您的位置: 首页 > 2023年12月 第38卷 第12期 > 文字全文
2023年7月 第38卷 第7期11
目录

角膜横径和晶状体厚度在 Barrett Universal Ⅱ人工晶状体计算公式中的应用价值

Application value of corneal horizontal diameter and lens thickness in Barrett Universal Ⅱ intraocular lens prediction formula

来源期刊: 眼科学报 | 2023年12月 第38卷 第12期 822-836 发布时间:2023-11-15 收稿时间:2024/3/13 17:07:43 阅读量:4440
作者:
关键词:
人工晶状体计算公式Barre Universal Ⅱ公式白内障手术准确性眼轴长度
intraocular lens calculation Barrett Universal II formula cataract surgery accuracy axial length
DOI:
10.12419/2308310001
收稿时间:
 
修订日期:
 
接收日期:
 
目的:探讨运用Barrett Universal Ⅱ公式(BUⅡ公式)计算人工晶状体(intraocular lens,IOL)屈光力时,可选参数角膜横径,又称白到白(white-to-white,W T W)与晶状体厚度(lens thickness,LT)的实际应用价值。方法:采用单中心、前瞻性临床研究,连续纳入同一术者顺利进行白内障超声乳化吸除术联合MX60(IOL植入术患眼279眼,术前使用OA-2000非接触式光学生物测量仪测量眼部数据并计算IOL植入度数,代入B UⅡ公式保留或去掉可选参数WTW、LT计算预测结果,进一步根据患者眼轴长度(axial length,AL)分亚组分析。主要结局指标:随访患者至术后1个月以上,比较使用和未使用WTW和LT两个参数、BUⅡ公式预测误差(prediction error,PE)、绝对预测误差(absolute error,AE)、AE小于0.5 D所占比例。结果:总体1上,忽略W T W + LT,PE为-0.05 D(-0.26, 0.18)(P=0.011),其他参数组合的PE与0比较差异无统计学意义(P>0.05)。各参数组合的AE比较差异无统计学意义(0.22~0.23 D,P= 0.404)。同时忽略WTW + LT时AE出现最大值(+1.5 D)。应用WTW + LT、忽略WTW + LT、忽略WTW和忽略LT时纳入患者AE ≤ 0.50 D的比例分别为80.65%、79.57%、80.65%和81.36%。在各眼轴亚组中,忽略LT时,AE ≤ 0.50 D的百分比在短眼轴亚组(80.00% vs.66.67%~73.33%)与长眼轴亚组(77.78% vs. 73.33%~75.56%)中较高。在中等眼轴亚组中,AE ≤ 0.50 D百分比代入全部参数时略高(83.11% vs. 80.82%~82.19%),忽略WTW + LT计算时稍低(80.82%)。结论:使用BU Ⅱ计算IOL屈光力时,可选参数WTW和LT无论是否代入公式中,皆可得到相近的平均预测水平;但是,同时忽略WTW和LT可能出现较大预测误差。对于22 mm ≤ AL<26 mm眼,推荐代入全部参数计算;当AL≤ 22 mm或AL ≥ 26 mm,仅输入WTW的计算方法累积精确度更高,可优先采用。
Objective: To investigate the practical application value of the optional parameters of corneal horizontal diameter or white to white (WTW) and lens thickness (LT) a using Barrett Universal II formula. Methods: Single-center, prospective clinical study. Eligible 279 eyes who underwent uneventful phacoemulsification and enVista MX60 implantation by the same surgeon were consecutively enrolled. OA-2000 (Tomey, Japan) non-contact optical biometry was used to measure the ocular data and calculate the IOL implantation power preoperatively. The BU II network formula was used to retain or remove optional parameters WTW and LT, and the predicted results were calculated. Further subgroup analysis was conducted based on the patient's axial length. Main outcome measures: Follow up patients for more than 1 month after surgery, compare the proportion of using and not using WTW and LT parameters, BU II formula prediction error (PE), absolute prediction error (AE), and AE less than 0.5 D. Results: Overall, ignoring WTW + LT, the median PE was -0.05 D (-0.26, 0.18) (P = 0.011) , and there is no statistically significant difference in PE compared 0 for the other parameter combinations (P > 0.05). There was no significant difference in the median AE of each parameter combination (0.22~0.23 D, P = 0.404). While ignoring both WTW and LT, the maximum AE value (+1.5 D) was found. The proportion of patients with AE ≤ 0.50 D included in the application of WTW+LT, neglect of WTW+LT, neglect of WTW, and neglect of LT were 80.65%, 79.57%, 80.65%, and 81.36%, respectively in each axial subgroup, when LT was ignored, the percentage of AE ≤ 0.50 D was higher in the short axial subgroup (80% vs. 66.67%~73.33%) and the long axial subgroup (77.78% vs. 73.33%~75.56%). In the subgroup of moderate eye axis, the percentage of AE ≤ 0.50 D was slightly higher when all parameters were substituted (83.11% vs. 80.82%~82.19%), and slightly lower when WTW+LT calculation was ignored (80.82%). Conclusions: When applying Barrett Universal II to calculate the refractive power of artificial lenses, the optional parameters WTW and LT can obtain similar average prediction levels regardless of whether they are substituted into the formula; However, ignoring both WTW and LT may result in significant prediction errors. For eyes with a diameter of 22 mm ≤ AL<26 mm, it is recommended to use all parameters for calculation; When AL ≤ 22 mm or AL ≥ 26 mm, the calculation method that only inputs WTW has higher cumulative accuracy, and it is suggested to be prioritized.
在屈光性白内障手术时代,准确的人工晶状体(intraocular lens,IOL)屈光力计算对于手术的成功不可或缺,纳入更多参数以提高公式计算准确性是新一代IOL计算公式的特点,白到白(white-to-white,WTW)、晶状体厚度(lens thickness,LT)、中央角膜厚度(central corneal thickness,CCT)等可选参数是新一代多变量IOL计算公式中的重要组成部分。然而当眼部生物测量给出可选参数测量值质量不佳时,是否重复测量或者舍弃这部分结果进行计算;或者当眼部生物测量条件匮乏场景中,如何仅使用必选参数为患者选择最恰当的IOL,这些困惑是开展这项研究的初衷。
Barrett Universal Ⅱ公式(BUⅡ公式)作为新一代公式中的代表性公式,共纳入眼轴(axial length,AL)、角膜曲率(keratometry,K)、前房深度(anterior chamber depth,ACD)、LT、WTW五个生物学参数,其中WTW和LT被列为可选参数(optional parameters),并被证实对全眼轴长眼睛都有较高的准确性[1–6],尤其对于中长眼轴的眼睛。这一公式不仅内置于IOLMaster700、OA-2000等光学生物测量仪,并且提供了网页版计算途径(APACRS:http://calc.apacrs.org/barrett_universal2105/)。GrahamBarrett曾在个人发言中提及BUⅡ部分基于光迹追踪原理,Koch等[7]在研究中将其归为基于高斯光学的聚散度公式。
因此,BUⅡ作为计算方法未知的黑箱公式,代入可选参数(WTW、LT)在 IOL度数计算中有怎样的实际价值,对于不同AL的患者又能否提高计算准确性,目前国内外尚无研究充分解答以上两个问题,本文旨在从总体人群与眼轴亚组的实际影响方面,探究增加预测参数能否提高实际预测准确性。

1 对象与方法

1.1 对象

1.1.1 患者资料
本前瞻性研究在山西省眼科医院伦理委员会批准(批件号:SXYYLL-KSSC001)下按照赫尔辛基宣言进行,在解释研究目的和性质后取得所有受试者的知情同意。连续纳入2020年5月—12月于山西省眼科医院白内障科行白内障超声乳化吸除联合IOL植入术的白内障患者,使用SS-OCT生物测量仪Tomey OA-2000完成术前生物测量712人次,测量指标包括AL、ACD、K、LT、WTW,完成手术治疗并植入MX60IOL累计351人次,术后满足纳排标准的患者累计纳入196人(279眼)。
纳入标准:1)术前眼部生物测量由同一位专业技术人员使用Tomey OA-2000完成。2)手术由同一位术者完成,手术切口3.0 mm,撕囊口直径约5.5 mm,手术顺利,囊袋内植入单焦点Bausch&LombMX60(双凸非球面,改良C襻,光学区6.0 mm,总直径12.5 mm, A常数119.1,折射率1.53)IOL。3)术后最佳矫正视力≥ 0.5(小数记录法),眼压正常,无术后并发症。4)随访时间不少于术后1个月,术眼屈光状态稳定(裂隙灯检查:角膜无水肿、后弹力层无皱褶、切口恢复良好、无前房反应、IOL在囊袋内稳定居中透明、未发生后发性白内障;角膜地形图检查:角膜切口处散光小,未引起视轴区散光波动)。
排除标准:1)有任何内眼手术史、眼部外伤史者。2)伴其他影响屈光间质疾病者:如葡萄膜炎、青光眼、翼状胬肉、角膜激光术后、角膜瘢痕、干眼等。3)晶状体全白、泪膜功能不佳等OA-2000无法测算或测算误差出现预警提醒的情况者。4)合并固定性斜视、眼球颤动无法固视等OA-2000无法正确对焦的情况者。
1.1.2 分组
依照参与计算的生物学参数,纳入眼的观察指标分为如下四组:1)忽略WTW + LT (omitting white-to-white and lens thickness,OWL)组;2)忽略WTW(omitting white-to-white,OW)组;3)忽略LT(omitting lens thickness,OL)组;4)无忽略参数ALL组。
在此基础上,所有纳入眼按照A L分为三个亚组:1)短眼轴亚组AL < 22 mm组(15眼),2)正常眼轴亚组22 mm≤ AL < 26 mm组(219眼),3)长眼轴亚组AL ≥ 26 mm组(45眼)。

1.2 方法

1)OA-2000生物测量:OA-2000基于Placido环以及SS-OCT原理进行眼部数据的测量,测量精度高,仪器测量速度快,平均一只眼8 s左右可完成测量;自动化程度高,自动检测角膜中心、自动捕捉数据并连续10次扫描眼轴完成一次检测、检测到不符合规范的眼部条件时自动重新开始测量,减轻了操作人员熟练度对数据质量的影响。
仪器自动测量AL、K、ACD、LT、WTW值,手动校准瞳孔轮廓及WTW边界,在测量过程中边界校准均由同一人完成,进一步减少人为误差。高度近视及白内障核混浊Ⅳ级及以上患者测量3次对比,取信噪比最高、波形最稳定一次的结果;其余泪膜稳定、固视良好、配合良好的患者测量1次。对于固视较差、大角度外斜视等无法准确捕捉角膜中心的患者,扫描激光的穿透方向不与角膜垂直影响测量质量,这部分患者被剔除。
完成测量后, OA-2000将会基于测量参数得出IOL屈光力预测结果,经对比,这一结果与BUⅡ公式的计算结果一致。
2)IOL屈光力计算:MX60 IOL屈光力计算由OA-2000内置的BUⅡ公式完成,计算同时参考了必选参数(AL、K、ACD)与可选参数(WTW、LT)。IOL植入度数确认后,进一步使用BUⅡ公式(网址:http://calc.apacrs.org/barrett_universal2105/)计算WTW、LT部分或全部忽略时对应的预测屈光度。
3)围术期管理及手术:患者均采用标准化白内障手术方案及统一围术期用药方案。
4)公式准确性评估:由公式准确性与主觉验光(manifest refraction)结果比较得到。主觉验光由有经验的验光师在术后至少1个月时完成,测量结果及等效球镜(spherical equivalence,SE)经过一位眼科医师分析核对其准确性后记录。分析不同参数组合的预测误差(prediction error,PE),绝对预测误差(absolute prediction error,AE)。计算预测误差的均值(mean prediction error, ME),标准差(standard deviation,SD)。计算绝对预测误差的均值(mean absolute prediction error,MAE)、绝对预测误差的中位数(median absolute prediction error,MedAE)以及预测误差在± 0.25、± 0.50、± 0.75、± 1.00 D范围内的眼数占总体眼数的百分比。

1.4 统计学方法

采用SPSS 25.0软件进行数据分析。定性资料采用频数(百分比)进行描述。定量资料先进行正态性检验,服从正态分布的定量资料采用x±s进行描述,不同AL的指标比较采用方差分析,两两比较采用LSD法。不服从正态分布的定量资料采用M(P25,P75)进行描述。最佳矫正视力(best corrected visual acuity,BCVA)以记录,并转换为最小分辨角对数(logarithm of minimal angle resolution,LogMAR)进行统计分析。SE与预测屈光度的比较采用Wilcoxon符号秩和检验,参数组合间比较AE采用Friedman检验。同一种参数组合时,眼轴亚组的组间比较采用Kruskal-Wallis H检验。AE在≤ 0.25、≤ 0.50、≤ 1.00、>1.00 D范围内累计频率的组间比较采用Cochran Q检验。多个样本进行非参数检验或率的比较有差异时,两两比较采用Bonferroni校正法。P<0.05为差异有统计学意义。

2 结果

2.1 研究对象的一般资料

研究共纳入患者196人(279眼),纳入患者的平均年龄为(67.58 ± 11.41)岁,眼轴平均长度为(24.28 ±2.47) mm,其中短、中、长眼轴亚组的平均A L分别为(21.55 ± 0.27)、(23.47 ± 0.81)、(29.10 ±2.37) mm。纳入患者的人口学及眼部生物测量参数见表1。

表1 纳入患者的一般资料

Table 1 Baseline Clinical Characteristics of All Participants (n = 279)

2.2 实际比较可选参数LT、WTW在公式中的应用价值

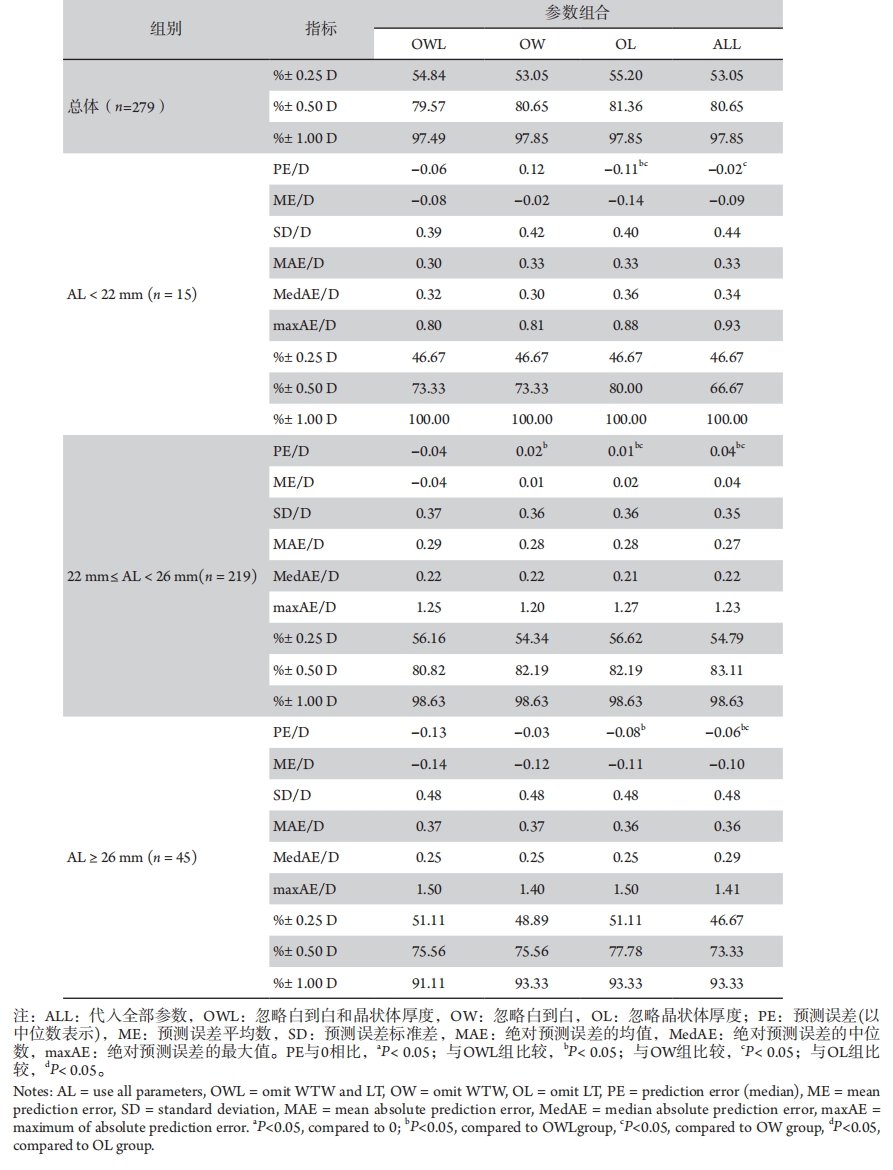
BUⅡ公式的实际PE及AE在总体上与各眼轴亚组间均不满足正态分布。BUⅡ公式的实际预测结果见表2和图1,预测误差在± 0.25、± 0.50、± 1.00 D范围内的累积分布见图2(各参数组合的预测结果分总体与各眼轴亚组报告)。公式应用中,通常将屈光误差在±0.50 D以内的眼百分比定义为该公式的准确率,因此本研究选定AE ≤ 0.5 D百分比作为BUⅡ公式预测准确性的指标。

表2 包含各种可选参数组合的BUⅡ公式实际屈光误差

Table 2 Actual refractive error of the BUⅡ formula containing optional parameter combinations


续表2

20240314104525_6108.jpg
图1 各参数组合平均绝对预测误差(D)分布的箱形图,包括总体与各眼轴亚组中的分布
Figure 1 Box plot of MAE (D) distribution in each parameter group, including the distribution in the overall population and in each AL subgroup
“S-”“M-”“L-”分别指短、中、长眼轴亚组的相应预测表现;橙色方框代表第二个四分位数,蓝色方框代表第三个四分位数;图1排除了上下四分位数之外的极值,直观展示了各组中位数水平的差异以及绝对预测误差中间50%数据的离散程度。
"S-", "M-", and "L-" refers to the corresponding prediction performance of the short, medium, and long AL subgroups, respectively. Orange boxes represent the second quartile, blue boxes represent the third quartile; Figure 1 excludes extreme values outside the upper and lower quartiles to visually demonstrate differences in median levels across groups and the degree of dispersion of data in the middle 50% of absolute prediction errors.
图2 在忽略部分可选参数或不忽略时,预测误差在指定屈光度范围内的累计频率堆叠柱状图
Figure 2 When ignoring some optional parameters or not, stacked histogram comparing the percentage of eyes with a given prediction error
图中列出了总体与各眼轴亚组中的分布。
The figure shows the distribution overall and in each AL subgroup.
总体上,BUⅡ公式预测准确性较高(AE ≤ 0.50 D眼百分比:79.57%~81.36%),同时忽略LT和WTW计算使PE增加(P=0.011),而忽略LT、WTW之一或代入全部参数的PE与0比较差异无统计学意义(P> 0.05);MAE、MedAE和± 0.25、± 0.50、± 1.00 D范围内的PE累计频率在BUⅡ公式的各参数组合间比较差异无统计学意义(P> 0.05)。虽然差异无统计学意义,但PE ± 0.50 D百分比在忽略LT时略高于其他参数组合的预测效果(81.36% vs. 79.57%~80.65%),这一现象同样出现于AL < 22 mm(80% vs. 66.67%~73.33%)和AL ≥26 mm亚组(77.78% vs. 73.33%~75.56%);在22 mm ≤ AL< 26 mm亚组中,PE ± 0.50 D百分比代入全部参数时略高(83.11% vs. 80.82%~82.19%),忽略WTW + LT计算时较低(80.82%)。
总计有2.15%(6/279)患者术后AE > 1.00 D(表3),其中短眼轴亚组0例、中等眼轴亚组2例、长眼轴亚组4例,中等眼轴亚组2例患者术前角膜散光较大(患者1:2.17 D,患者2:1.2 D,均为OA-2000测量K2?K1的结果),患者1角膜散光不规则,未植入散光矫正型IOL,术后主觉验光:+0.25 DS /-2.50 DC ×105°→0.9,患者2手术切口位置135°,陡峭轴位置171°,术后主觉验光为-0.75 DS /-1.25 DC ×95→1.0。这6例患者均同时在四种参数组合中呈现较大的预测误差,而不同参数组合本身引起误差波动较小,提示误差为公式系统误差引起。

表3 AE> 1.00 D眼数组间分布

Table 3 Distribution of the number of eyes with AE > 1.00 D between groups

3 讨论

BUⅡ的IOL计算公式是目前IOL度数预测较常用也较准确的公式之一,为了探究可选参数是否能提高这一公式的预测准确性,从而为临床公式选择提供进一步的参考,本研究首次基于OA-2000生物测量仪,前瞻性比较BUⅡ公式在代入不同可选参数(WTW、LT)计算时的实际预测结果。由于公式应用中,通常将屈光误差在± 0.50 D以内的眼百分比定义为该公式的准确率,因此本研究选定AE ≤ 0.5 D百分比作为主要结局指标之一。研究结果表明,与忽略WTW和LT相比,至少代入WTW或LT一项进行计算时预测误差PE较小,AE ≤ 0.5 D百分比较高。在中等长度眼轴患者中,同时代入两个可选参数可以提高公式准确率,在短眼轴与长眼轴亚组中,仅代入WTW计算时拥有较高的公式准确率。
多变量公式通过引入更多眼前节参数并结合多样化的预测原理优化计算结果,这些公式中,绝大部分是原理未公布的黑箱公式,例如本研究纳入的BUⅡ公式。已有多项研究展示了BUⅡ公式代入全部参数计算时的准确性。本研究得到的BUⅡ公式总体准确率为80.65%,与既往研究约70.7%~85.03%[1,3-4,8–10]的准确率范围符合。由于AL每改变1 mm将带来约?2.3 D屈光不正[11-12],AL是预测IOL屈光力的核心参数之一,同时一条公式应用于短、中、长眼轴组中,预测准确性可能存在较大差异[13],因此依照AL分组分析IOL计算公式的准确性是必要的。BUⅡ公式在不同AL时预测准确性有差异:对于短眼轴眼,本研究的公式准确率为66.67%,MedAE为0.34 D。Shammas等[10]回顾性分析了17种公式应用于595眼的预测表现,短眼轴眼中BUⅡ公式(70.5%,0.31 D)与Kane公式(69.2%,0.35 D)准确率相近。一项纳入11种公式(不包含Kane公式)针对2 395只短眼轴眼的荟萃分析显示[14],BUⅡ公式的MAE(0.47 D)、MedAE(0.26 ~ 0.54 D)最小,差异无统计学意义,公式平均准确率63.4%。总体而言,BUⅡ公式对短眼轴患者的屈光误差预测不够稳定,目前报道[10]EVO、K6、Olsen和PEARL-DGS等基于人工智能及光迹追踪的公式预测准确性较好(76.9%~ 80.8%)。对于中等长度眼轴眼,本研究BUⅡ公式准确率为83.11%,MedAE 0.22 D,与既往研究结果相近。Olga等[15]发现75岁及以上正常眼轴白内障患者中,与传统公式(Haigis、Hoffer Q、Holladay 1和SRK/T)相比,BUⅡ(72.22%,MedAE0.33 D)及Kane(72.22%,MedAE 0.35 D)公式准确率较高。 Pereira等[9]针对764例白内障患眼研究12种公式的准确性,发现总准确率最高的2种公式是Kane(77.7%)和BUⅡ(77.4%),对于长眼轴眼,BUⅡ准确率最高(76.7%,MedAE 0.29 D)。本研究中,长眼轴眼应用BUⅡ公式MedAE 0.29 D、准确率73.33%,Bernardes等[16]及Chen等[17]研究表明基于人工智能的Hill-RBF 2.0 公式在超长眼轴眼(≥ 30 mm)中预测精确度(70.6%,0.31 D)高于Kane(67.1%,0.33 D)和BUⅡ(63.0%,0.36 D)公式,但这一公式目前在国内较少使用;Guo团队[18]发现,EVO 2.0、Kane、BUⅡ和Olsen公式在长眼轴中的预测效果优于传统公式。综上所述,BUⅡ公式在全眼轴长眼中普遍应用,拥有较好的预测准确性,但调整代入参数后,需考虑各眼轴组公式预测准确性的变化。
尽管准确测量并代入全部参数的BUⅡ公式准确率尚可,但是可选参数是否输入对计算结果有影响。目前,仅有少量研究探索了WTW或LT等可选参数对BUⅡ或其他多变量公式的贡献,这些可选参数代入更准还是不代入更准,临床尚无共识。笔者在研究前期,探究了忽略特定参数时理论屈光误差的偏移,发现与纳入全部参数计算相比,忽略WTW、LT、WTW + LT进行计算均会导致理论上的屈光误差增加(P< 0.001)。忽略可选参数与不忽略相比的理论误差范围图中(图3),误差绝对值范围为0~0.41 D(中位数范围0.03~0.10 D)。不同眼轴亚组中,可选参数对长眼轴患者计算结果影响最小。可选参数LT引起的预测屈光度变化最小,预测价值有限,这与Taroni等[19]及Vega等[20]学者团队既往的研究结果一致。
本研究在实际预测中发现,与其他参数组合相比,忽略LT组的总体与长、短眼轴亚组PE在± 0.5 D内比例较高,依次为80.65%、73.33%和66.67%。这与Vega等[20]研究结果一致,但既往Wendelstein等[21]认为WTW这一参数对于BUⅡ公式预测准确性无帮助,这可能与他们使用了自动测量后WTW边缘无法调整的生物测量仪有关(如IOLMaster500/700)。研究表明进行WTW自动测量时,测量结果可变性较大,提示现有的光学生物测量仪对于角膜缘灰白偏白区域的识别能力有待提高。而本研究自动测量WTW后,由同一位医生手动校准取值边缘,以确保WTW结果的参考价值。本研究结果提示WTW的准确测量对于公式应用这一参数有重要意义。笔者发现,忽略WTW时(仅纳入LT), AE准确率未见明显提高,AE差异无统计学意义,类似研究中Taroni等[19]同样认为输入LT不会提高BUⅡ公式的预测准确性,Vega等[20]认为AL>22 mm以上时,忽略可选参数时预测结果与不忽略差别很小,但仅做术前理论值比较,未明确引入术后实际误差后,几种预测方法的对比是否会扩大或减小差别。忽略WTW + LT时,与代入全部参数相比,总体与各眼轴亚组PE较大,预测屈光度更偏近视(PE中位数?0.13 ~ ?0.04 D),预测准确率在总体(79.57%)与中等眼轴亚组(83.11%)最低。纳入全部参数计算时,中等眼轴患者的预测准确率较高(83.11%)。
对于其他多变量公式,Srivannaboon等[22]前瞻性探索了LT对Holladay2公式预测效果的影响,未发现明显的差异。Li等[23]对Kane公式可选参数贡献做理论比较,发现LT对短眼轴浅前房和陡峭角膜平均曲率患者的预测结果有明显影响,CCT对Kane公式结果无影响。Wendelstein等[21]回顾性比较了251眼患者在新一代公式(BUⅡ、EVO 2.0、Hill- RBF 3.0、Kane、Castrop、PEARL-DGS 公式)中的预测表现,发现可选参数WTW、LT等在不同公式中有不同程度的影响。因此,为了更精准地进行屈光手术,观察判断这些纳入的可选参数对IOL预测的贡献,有重要的临床价值。
本研究中,纳入不同的可选参数组合或者随着患者AL的不同,可观察到预测准确程度的不稳定性,这可能与WTW与LT随着眼轴增长均呈现非线性变化[24–26],参数仍存在不可预测性有关。甚至对公式进行理论比较时,不同参数组合在不同AL的白内障患眼中会呈现不一致的屈光漂移趋势(图3)。如果能够纳入人群中较极端的LT、WTW值观察,也许能更清晰地分析不同参数在公式中的贡献;如果BUⅡ公式等未公开多变量公式的作者能够针对代入的可选参数组合在不同AL群体中分别优化预测,也许能够进一步提高公式的预测准确性。
对于长眼轴(AL > 26 mm)患者,观察到可选参数对公式贡献较小,而对于部分轴性超高度近视患者(AL ≥30 mm),输入可选参数与否,预测结果完全相同。本次研究在12例(15眼)中,观察到了理论预测结果完全相同的情况,其平均AL 31.87 mm,中位数AL 31.76 mm,AL最短30.36 mm,最长34.34 mm。这侧面证明BUⅡ对于超高度近视患者IOL度数计算不依赖LT或WTW。而对于26 mm≤ AL <30 mm患者(n = 30),笔者发现忽略LT(仅纳入WTW)时,较之其他参数组合的预测误差在± 0.5 D比例较高80.00%(24/30),高于AL ≥26 mm患者(n = 45)时准确率73.33%,并与中等长度眼轴累积准确率(83.11%)接近,因此推荐输入WTW进行IOL度数计算。
对于短眼轴(AL < 22 mm)患者,由于样本人口学特点,被归类为短眼轴例数较少,可能会影响统计分析的效能。各参数组合的理论屈光误差差异无统计学意义,但预测误差分布范围较大(图3)。实际预测时,短眼轴患者在忽略WTW + LT时获得AE最小范围(0~0.80 D);此外在忽略LT时,虽然差异无统计学意义,但BUⅡ公式准确率高于其他参数组合(80% vs. 66.67%~ 73.33%)。此外,相比于忽略参数组,短眼轴患者代入全部参数计算时得到了最大MAE 0.33 D、最大MedAE 0.34 D、最大maxAE 0.93 D 与最低AE ≤ 0.5 D百分比66.67%,提示同时纳入WTW与LT并不能有效提高短眼轴患者预测准确性,似乎纳入WTW与LT并不能有效提高短眼轴患者预测准确性,这可能与短眼轴患者前房拥挤,LT在短眼中随AL增长非线性增厚[26],推挤晶状体虹膜隔前移造成ACD与LT比率失衡有关[20]。根据既往研究[10]EVO和Kane在短眼轴公式中较为准确,推荐使用多公式计算比较后确定植入度数更为稳妥。
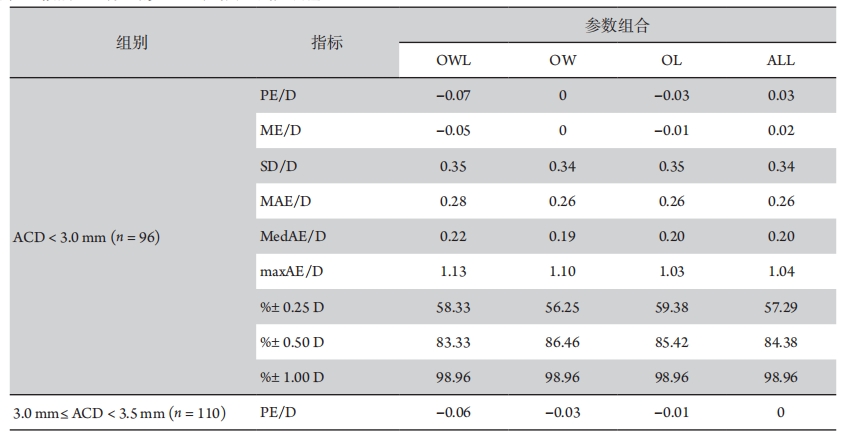
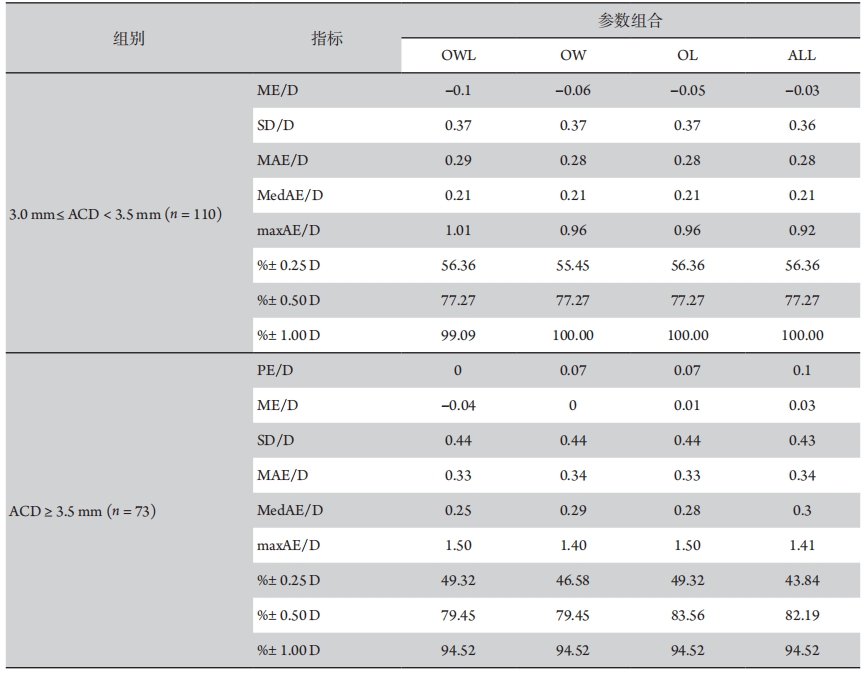
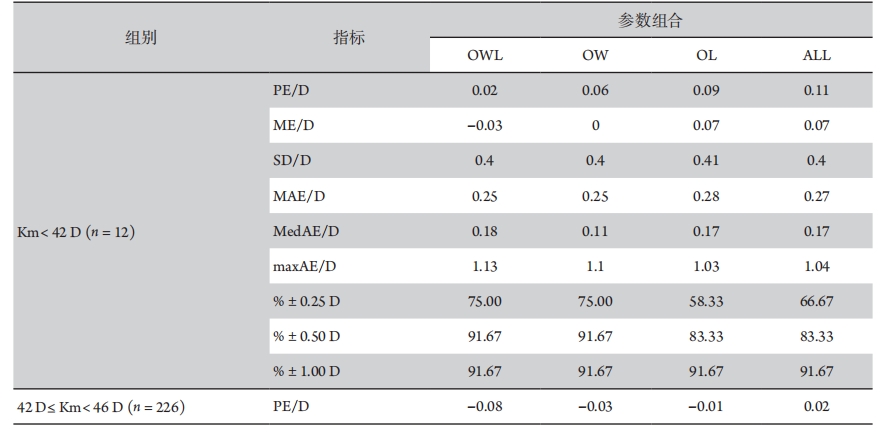
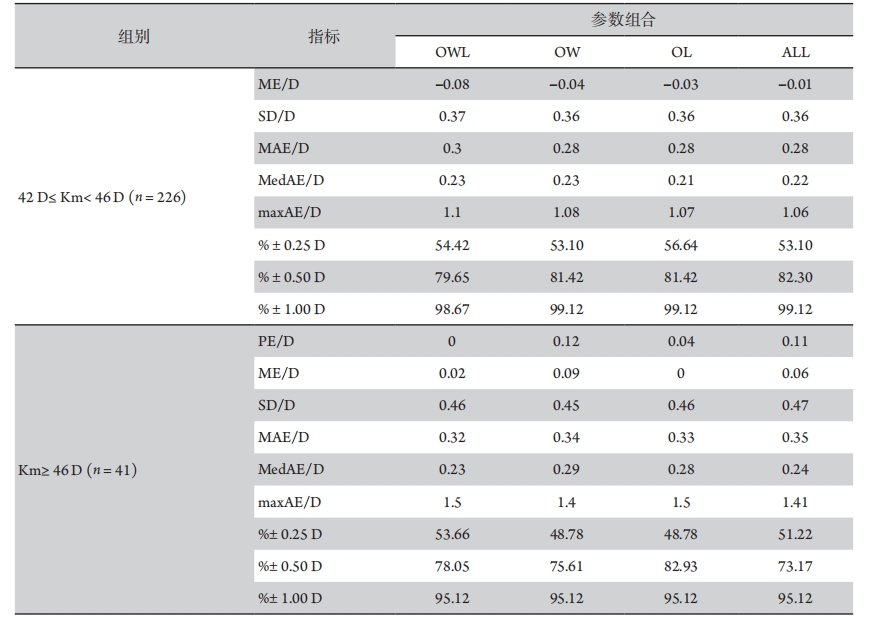
根据IOL屈光力计算公式既往研究[12],生物学参数与屈光误差的相关性AL > ACD > K,因此在整体比较可选参数贡献之外,本研究优先选择了根据A L长度分亚组分析,但考虑到ACD与K值对可选参数应用可能的影响,参考既往研究的分组标准,进一步根据不同ACD[27](浅ACD亚组ACD < 3.0 mm,正常ACD亚组3.0 mm ≤ ACD < 3.5 mm,深ACD亚组ACD > 3.5 mm)和不同Km[23](扁平Km亚组Km< 42 D,正常Km亚组42 D ≤ Km < 46 D,陡峭Km亚组Km> 46 D)分组并进行了初步的分析观察,详见附表1、2。1)按照ACD分组:总体上,三亚组患眼数量分布较为均衡,ACD > 3.5 mm时BUⅡ公式MedAE较大(0.25~0.30 D)。对于浅、正常、深ACD亚组患者,同时忽略WTW和LT时maxAE最大,分别为1.13、1.01、1.50 D。各参数组合PE ± 0.50 D百分比:浅ACD患者在忽略WTW时略高,忽略两个参数时略低;正常ACD患者各组百分比完全相同;深ACD患者在忽略LT时略高,忽略两个参数时略低。综上所述,无论ACD深或浅,均不建议同时忽略两个可选参数。2)按照Km分组:总体上,扁平Km亚组(n = 12)与陡峭Km亚组(n = 41)例数较少,但对于扁平、正常、陡峭Km亚组患者,依然存在同时忽略WTW和LT时maxAE最大的趋势,分别为1.13、1.10、1.50 D。在正常Km患者中观察到代入全部参数时各项屈光误差指标均得到最小值,提示WTW与LT能够有效提高正常Km患者的预测准确性。
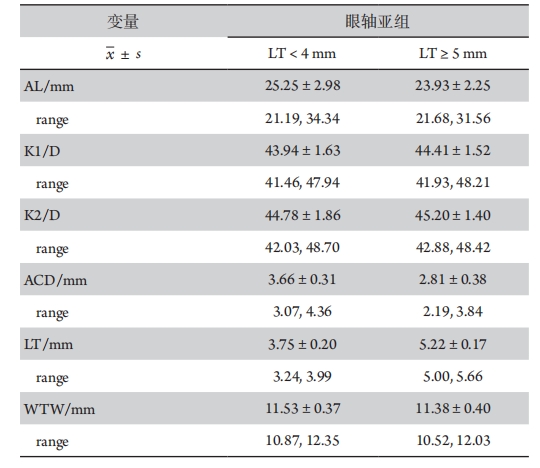
在B UⅡ公式的实际应用中,极端LT与极端WTW是否代入计算也是临床重点关注的问题。其中极端LT指LT < 4 mm(薄晶状体)或LT ≥ 5 mm(厚晶状体)。根据针对24 013例中国白内障患者的调查[26],LT均值为(4.51±0.44) mm,74.45%的患者LT在正常值范围内。本研究中包含薄晶状体44眼,厚晶状体2 8眼,其基线信息及预测误差情况见附表3、4,分析发现当LT较薄或较厚时,预测准确性(75.00%~79.55%;75.00%~82.14%)普遍低于总人群中水平(79.57%~81.36%)。当LT< 4 mm,同时忽略两个可选参数预测准确性最低(75.00%),但忽略LT(仅代入WTW)时获得最高预测准确率(79.55%),提示LT较薄时不建议代入LT计算;当LT ≥5 mm,同时忽略两个可选参数预测准确性最低(75.00%),仅代入LT计算获得最高预测准确率(82.14%),提示LT较厚时建议代入计算以提高预测准确性。极端WTW指W TW < 10 mm(小角膜),或WTW> 13 mm(大角膜)。本研究中患者角膜横径范围为10~12.55 mm,未包含极端WTW的患者,也将在今后临床实践中进一步观察。
本研究因以下几个因素的影响而略显不足:首先,随访时间设置为术后1个月及以上,相较于3个月的共识略短。研究表明3.0 mm透明角膜微切口白内障患者SIA、术后BCVA及SE在术后1个月达到稳定[28-30],术后纳入记录的患者复查数据均为不少于术后1个月数据,若患者最后一次复查为术后3个月则纳入最后一次复查数据。其次,本研究中短眼轴患者的样本例数较少,展现预测趋势不明确,少量频数的变化会引起分布频率较大波动,希望后续能更多收集短眼轴患者,更明确地展现忽略可选参数在短眼轴亚组的预测趋势。本研究纳入了一种单焦点IOL作为研究对象,今后可以继续进行多种类、多型号IOL平台的对比研究。可以进一步收集合并极端LT值以及极端WTW值(小角膜、大角膜)的特殊白内障病例进行极端值的预测研究。综上所述,在使用BUⅡIOL计算公式时,同时忽略WTW和LT可能出现较大预测误差。在确保数据质量的情况下,至少代入WTW或LT之一的可选参数,更有可能获得相对准确的预测结果。

附表1 按照ACD分组的BUⅡ公式实际屈光误差

20240314105847_9706.jpg

续附表1

20240314105922_6603.jpg

附表2 按照Km分组的BUⅡ公式实际屈光误差

20240314110122_7282.jpg

续附表2

20240314110202_6998.jpg

附表3 极端LT患者基线信息表

20240314110307_8272.jpg

附表4 极端LT患者预测误差表

20240314110354_9697.jpg

利益冲突

所有作者均声明不存在利益冲突。

开放获取声明

本文适用于知识共享许可协议(Creative Commons),允许第三方用户按照署名(BY)-非商业性使用(NC)-禁止演绎(ND)(CC BY-NC-ND)的方式共享,即允许第三方对本刊发表的文章进行复制、发行、展览、表演、放映、广播或通过信息网络向公众传播,但在这些过程中必须保留作者署名、仅限于非商业性目的、不得进行演绎创作。详情请访问:https://creativecommons.org/licenses/by-nc-nd/4.0/
1、Darcy K, Gunn D, Tavassoli S, et al. Assessment of the accuracy of new and updated intraocular lens power calculation formulas in 10 930 eyes from the UK National Health Service[ J]. J Cataract Refract Surg, 2020, 46(1): 2-7.Darcy K, Gunn D, Tavassoli S, et al. Assessment of the accuracy of new and updated intraocular lens power calculation formulas in 10 930 eyes from the UK National Health Service[ J]. J Cataract Refract Surg, 2020, 46(1): 2-7.
2、Rong X, He W, Zhu Q, et al. Intraocular lens power calculation in eyes with extreme myopia: comparison of Barrett Universal II, Haigis, and Olsen formulas[ J]. J Cataract Refract Surg, 2019, 45(6): 732-737.Rong X, He W, Zhu Q, et al. Intraocular lens power calculation in eyes with extreme myopia: comparison of Barrett Universal II, Haigis, and Olsen formulas[ J]. J Cataract Refract Surg, 2019, 45(6): 732-737.
3、Kane JX, Van Heerden A, Atik A, et al. Intraocular lens power formula accuracy: comparison of 7 formulas[ J]. J Cataract Refract Surg, 2016, 42(10): 1490-1500.Kane JX, Van Heerden A, Atik A, et al. Intraocular lens power formula accuracy: comparison of 7 formulas[ J]. J Cataract Refract Surg, 2016, 42(10): 1490-1500.
4、Carmona-González D, Castillo-Gómez A, Palomino-Bautista C, et al. Comparison of the accuracy of 11 intraocular lens power calculation formulas[ J]. Eur J Ophthalmol, 2021, 31(5): 2370-2376.Carmona-González D, Castillo-Gómez A, Palomino-Bautista C, et al. Comparison of the accuracy of 11 intraocular lens power calculation formulas[ J]. Eur J Ophthalmol, 2021, 31(5): 2370-2376.
5、Shrivastava AK, Behera P, Kumar B, et al. Precision of intraocular lens power prediction in eyes shorter than 22 mm: an analysis of 6 formulas[ J]. J Cataract Refract Surg, 2018, 44(11): 1317-1320.Shrivastava AK, Behera P, Kumar B, et al. Precision of intraocular lens power prediction in eyes shorter than 22 mm: an analysis of 6 formulas[ J]. J Cataract Refract Surg, 2018, 44(11): 1317-1320.
6、G%C3%B6kce%20SE%2C%20Zeiter%20JH%2C%20Weikert%20MP%2C%20et%20al.%20Intraocular%20lens%20power%20%0Acalculations%20in%20short%20eyes%20using%207%20formulas%5B%20J%5D.%20J%20Cataract%20Refract%20Surg%2C%20%0A2017%2C%2043(7)%3A%20892-897.G%C3%B6kce%20SE%2C%20Zeiter%20JH%2C%20Weikert%20MP%2C%20et%20al.%20Intraocular%20lens%20power%20%0Acalculations%20in%20short%20eyes%20using%207%20formulas%5B%20J%5D.%20J%20Cataract%20Refract%20Surg%2C%20%0A2017%2C%2043(7)%3A%20892-897.
7、Wang L, Koch DD, Hill W, et al. Pursuing perfection in intraocular lens calculations: III. Criteria for analyzing outcomes[ J]. J Cataract Refract Surg, 2017, 43(8): 999-1002.Wang L, Koch DD, Hill W, et al. Pursuing perfection in intraocular lens calculations: III. Criteria for analyzing outcomes[ J]. J Cataract Refract Surg, 2017, 43(8): 999-1002.
8、Kane JX, Chang DF. Intraocular lens power formulas, biometry, and intraoperative aberrometry: a review[ J]. Ophthalmology, 2021, 128(11): e94-e114.Kane JX, Chang DF. Intraocular lens power formulas, biometry, and intraoperative aberrometry: a review[ J]. Ophthalmology, 2021, 128(11): e94-e114.
9、Pereira A, Popovic MM, Ahmed Y, et al. A comparative analysis of 12 intraocular lens power formulas[ J]. Int Ophthalmol, 2021, 41(12): 4137-4150.Pereira A, Popovic MM, Ahmed Y, et al. A comparative analysis of 12 intraocular lens power formulas[ J]. Int Ophthalmol, 2021, 41(12): 4137-4150.
10、Shammas HJ, Taroni L, Pellegrini M, et al. Accuracy of newer intraocular lens power formulas in short and long eyes using sum-of-segments biometry[ J]. J Cataract Refract Surg, 2022, 48(10): 1113- 1120.Shammas HJ, Taroni L, Pellegrini M, et al. Accuracy of newer intraocular lens power formulas in short and long eyes using sum-of-segments biometry[ J]. J Cataract Refract Surg, 2022, 48(10): 1113- 1120.
11、Kansal V, Schlenker M, Ahmed IIK. Interocular axial length and corneal power differences as predictors of postoperative refractive outcomes after cataract surgery[ J]. Ophthalmology, 2018, 125(7): 972-981.Kansal V, Schlenker M, Ahmed IIK. Interocular axial length and corneal power differences as predictors of postoperative refractive outcomes after cataract surgery[ J]. Ophthalmology, 2018, 125(7): 972-981.
12、Gaurisankar ZS, van Rijn GA, Lima JEE, et al. Correlations between ocular biometrics and refractive error: a systematic review and meta-analysis[ J]. Acta Ophthalmol, 2019, 97(8): 735-743.Gaurisankar ZS, van Rijn GA, Lima JEE, et al. Correlations between ocular biometrics and refractive error: a systematic review and meta-analysis[ J]. Acta Ophthalmol, 2019, 97(8): 735-743.
13、Melles RB, Holladay JT, Chang WJ. Accuracy of intraocular lens calculation formulas[ J]. Ophthalmology, 2018, 125(2): 169-178.Melles RB, Holladay JT, Chang WJ. Accuracy of intraocular lens calculation formulas[ J]. Ophthalmology, 2018, 125(2): 169-178.
14、SShrivastava AK, Nayak S, Mahobia A, et al. Accuracy of intraocular lens power calculation formulae in short eyes: a systematic review and meta-analysis[ J]. Indian J Ophthalmol, 2022, 70(3):740-748. SShrivastava AK, Nayak S, Mahobia A, et al. Accuracy of intraocular lens power calculation formulae in short eyes: a systematic review and meta-analysis[ J]. Indian J Ophthalmol, 2022, 70(3):740-748.
15、Reitblat O, Gali HE, Chou L, et al. Intraocular lens power calculation in the elderly population using the Kane formula in comparison with existing methods[ J]. J Cataract Refract Surg, 2020, 46(11): 1501-1507.Reitblat O, Gali HE, Chou L, et al. Intraocular lens power calculation in the elderly population using the Kane formula in comparison with existing methods[ J]. J Cataract Refract Surg, 2020, 46(11): 1501-1507.
16、Bernardes J, Raimundo M, Lobo C, et al. A comparison of intraocular lens power calculation formulas in high myopia[ J]. J Refract Surg, 2021, 37(3): 207-211.Bernardes J, Raimundo M, Lobo C, et al. A comparison of intraocular lens power calculation formulas in high myopia[ J]. J Refract Surg, 2021, 37(3): 207-211.
17、Chen Y, Wei L, He W, et al. Comparison of Kane, hill-RBF 2.0, barrett universal II, and emmetropia verifying optical formulas in eyes with extreme myopia[ J]. J Refract Surg, 2021, 37(10): 680-685.Chen Y, Wei L, He W, et al. Comparison of Kane, hill-RBF 2.0, barrett universal II, and emmetropia verifying optical formulas in eyes with extreme myopia[ J]. J Refract Surg, 2021, 37(10): 680-685.
18、Guo C, Yin S, Qiu K, et al. Comparison of accuracy of intraocular lens power calculation for eyes with an axial length greater than 29.0 mm[ J]. Int Ophthalmol, 2022, 42(7): 2029-2038.Guo C, Yin S, Qiu K, et al. Comparison of accuracy of intraocular lens power calculation for eyes with an axial length greater than 29.0 mm[ J]. Int Ophthalmol, 2022, 42(7): 2029-2038.
19、Taroni L, Hoffer KJ, Lupardi E, et al. Accuracy of new intraocular lens power calculation formulas: a lens thickness study[ J]. J Refract Surg, 2021, 37(3): 202-206.Taroni L, Hoffer KJ, Lupardi E, et al. Accuracy of new intraocular lens power calculation formulas: a lens thickness study[ J]. J Refract Surg, 2021, 37(3): 202-206.
20、Vega Y, Gershoni A, Achiron A, et al. High agreement between barrett universal II calculations with and without utilization of optional biometry parameters[ J]. J Clin Med, 2021, 10(3): 542. Vega Y, Gershoni A, Achiron A, et al. High agreement between barrett universal II calculations with and without utilization of optional biometry parameters[ J]. J Clin Med, 2021, 10(3): 542.
21、Wendelstein%20JA%2C%20Rothb%C3%A4cher%20J%2C%20Heath%20M%2C%20et%20al.%20Influence%20and%20predictive%20%0Avalue%20of%20optional%20parameters%20in%20new-generation%20intraocular%20lens%20%0Aformulas%5B%20J%5D.%20J%20Cataract%20Refract%20Surg%2C%202023%2C%2049(8)%3A%20795-803.Wendelstein%20JA%2C%20Rothb%C3%A4cher%20J%2C%20Heath%20M%2C%20et%20al.%20Influence%20and%20predictive%20%0Avalue%20of%20optional%20parameters%20in%20new-generation%20intraocular%20lens%20%0Aformulas%5B%20J%5D.%20J%20Cataract%20Refract%20Surg%2C%202023%2C%2049(8)%3A%20795-803.
22、Srivannaboon S, Chirapapaisan C, Chirapapaisan N, et al. Accuracy of Holladay 2 formula using IOLMaster parameters in the absence of lens thickness value[ J]. Graefes Arch Clin Exp Ophthalmol, 2013, 251(11): 2563-2567.Srivannaboon S, Chirapapaisan C, Chirapapaisan N, et al. Accuracy of Holladay 2 formula using IOLMaster parameters in the absence of lens thickness value[ J]. Graefes Arch Clin Exp Ophthalmol, 2013, 251(11): 2563-2567.
23、Li XY, Liao X, Lin J, et al. Effect of optional biometric parameters in the Kane formula on intraocular lens power calculation[ J]. PLoS One, 2023, 18(8): e0289033.Li XY, Liao X, Lin J, et al. Effect of optional biometric parameters in the Kane formula on intraocular lens power calculation[ J]. PLoS One, 2023, 18(8): e0289033.
24、Lam S. Comparison of age-derived lens thickness to optically measured lens thickness in IOL power calculation: a clinical study[ J]. J Refract Surg, 2012, 28(2): 154-155.Lam S. Comparison of age-derived lens thickness to optically measured lens thickness in IOL power calculation: a clinical study[ J]. J Refract Surg, 2012, 28(2): 154-155.
25、Wei L, He W, Meng J, et al. Evaluation of the white-to-white distance in 39, 986 Chinese cataractous eyes[ J]. Invest Ophthalmol Vis Sci, 2021, 62(1): 7.Wei L, He W, Meng J, et al. Evaluation of the white-to-white distance in 39, 986 Chinese cataractous eyes[ J]. Invest Ophthalmol Vis Sci, 2021, 62(1): 7.
26、Meng J, Wei L, He W, et al. Lens thickness and associated ocular biometric factors among cataract patients in Shanghai[ J]. Eye Vis, 2021, 8(1): 22.Meng J, Wei L, He W, et al. Lens thickness and associated ocular biometric factors among cataract patients in Shanghai[ J]. Eye Vis, 2021, 8(1): 22.
27、Hipólito-Fernandes D, Luís ME, Serras-Pereira R , et al. Anterior chamber depth, lens thickness and intraocular lens calculation formula accuracy: nine formulas comparison[ J]. Br J Ophthalmol, 2022, 106(3): 349-355.Hipólito-Fernandes D, Luís ME, Serras-Pereira R , et al. Anterior chamber depth, lens thickness and intraocular lens calculation formula accuracy: nine formulas comparison[ J]. Br J Ophthalmol, 2022, 106(3): 349-355.
28、Yang J, Wang X, Zhang H, et al. Clinical evaluation of surgery-induced astigmatism in cataract surgery using 2.2 mm or 1.8 mm clear corneal micro-incisions[ J]. Int J Ophthalmol, 2017, 10(1): 68-71.Yang J, Wang X, Zhang H, et al. Clinical evaluation of surgery-induced astigmatism in cataract surgery using 2.2 mm or 1.8 mm clear corneal micro-incisions[ J]. Int J Ophthalmol, 2017, 10(1): 68-71.
29、Conrad-Hengerer I, Al Sheikh M, Hengerer FH, et al. Comparison of visual recovery and refractive stability between femtosecond laser-assisted cataract surgery and standard phacoemulsification: six-month follow-up[ J]. J Cataract Refract Surg, 2015, 41(7): 1356-1364.Conrad-Hengerer I, Al Sheikh M, Hengerer FH, et al. Comparison of visual recovery and refractive stability between femtosecond laser-assisted cataract surgery and standard phacoemulsification: six-month follow-up[ J]. J Cataract Refract Surg, 2015, 41(7): 1356-1364.
30、Dzhaber D, Mustafa OM, Alsaleh F, et al. Visual and refractive outcomes and complications in femtosecond laser-assisted versus conventional phacoemulsification cataract surgery: findings from a randomised, controlled clinical trial[ J]. Br J Ophthalmol, 2020, 104(11): 1596-1600.Dzhaber D, Mustafa OM, Alsaleh F, et al. Visual and refractive outcomes and complications in femtosecond laser-assisted versus conventional phacoemulsification cataract surgery: findings from a randomised, controlled clinical trial[ J]. Br J Ophthalmol, 2020, 104(11): 1596-1600.
上一篇
下一篇
其他期刊
  • 眼科学报

    主管:中华人民共和国教育部
    主办:中山大学
    承办:中山大学中山眼科中心
    主编:林浩添
    主管:中华人民共和国教育部
    主办:中山大学
    浏览
  • Eye Science

    主管:中华人民共和国教育部
    主办:中山大学
    承办:中山大学中山眼科中心
    主编:林浩添
    主管:中华人民共和国教育部
    主办:中山大学
    浏览
推荐阅读
出版者信息
目录