Optic disc drusen (ODD) are rounded, calcified, concentrically laminated hyaline deposits situated in the prelaminar tissue of the optic nerve. Though they are predominantly dense nuggets of calcium phosphate, Ca3(PO4)2, ODD also contain mucopolysaccharides, glycoproteins, amino acids, and nucleic acids (1-3). Optically, ODD are glassy and translucent; they autofluorescence (4) but are not birefringent (5). Although most patients with ODD are asymptomatic, visual field loss is common, occurring in up to 50% of children and 87% of adults (6). As there is no known prevention of or treatment for ODD, the primary clinical relevance of ODD is their tendency to mimic optic disc edema.
Superficial ODD are evident during ophthalmoscopy as bright lumpy refractile bodies shimmering within the substance of the optic disc (7). ODD that are not superficial are called “buried”; though they may sometimes betray their presence by causing non-edematous optic disc elevation, more often they do not affect the ophthalmoscopic appearance of the optic disc at all. In the general population, superficial ODD have a prevalence of 0.2–0.3% (8,9), but cadaveric and enucleated histopathological specimens reveal a much higher prevalence of combined superficial and buried ODD, at 1.8–2.0% (3,10). Ophthalmoscopy and fundus photography are therefore insensitive tools for detecting and assessing ODD, particularly buried ODD.
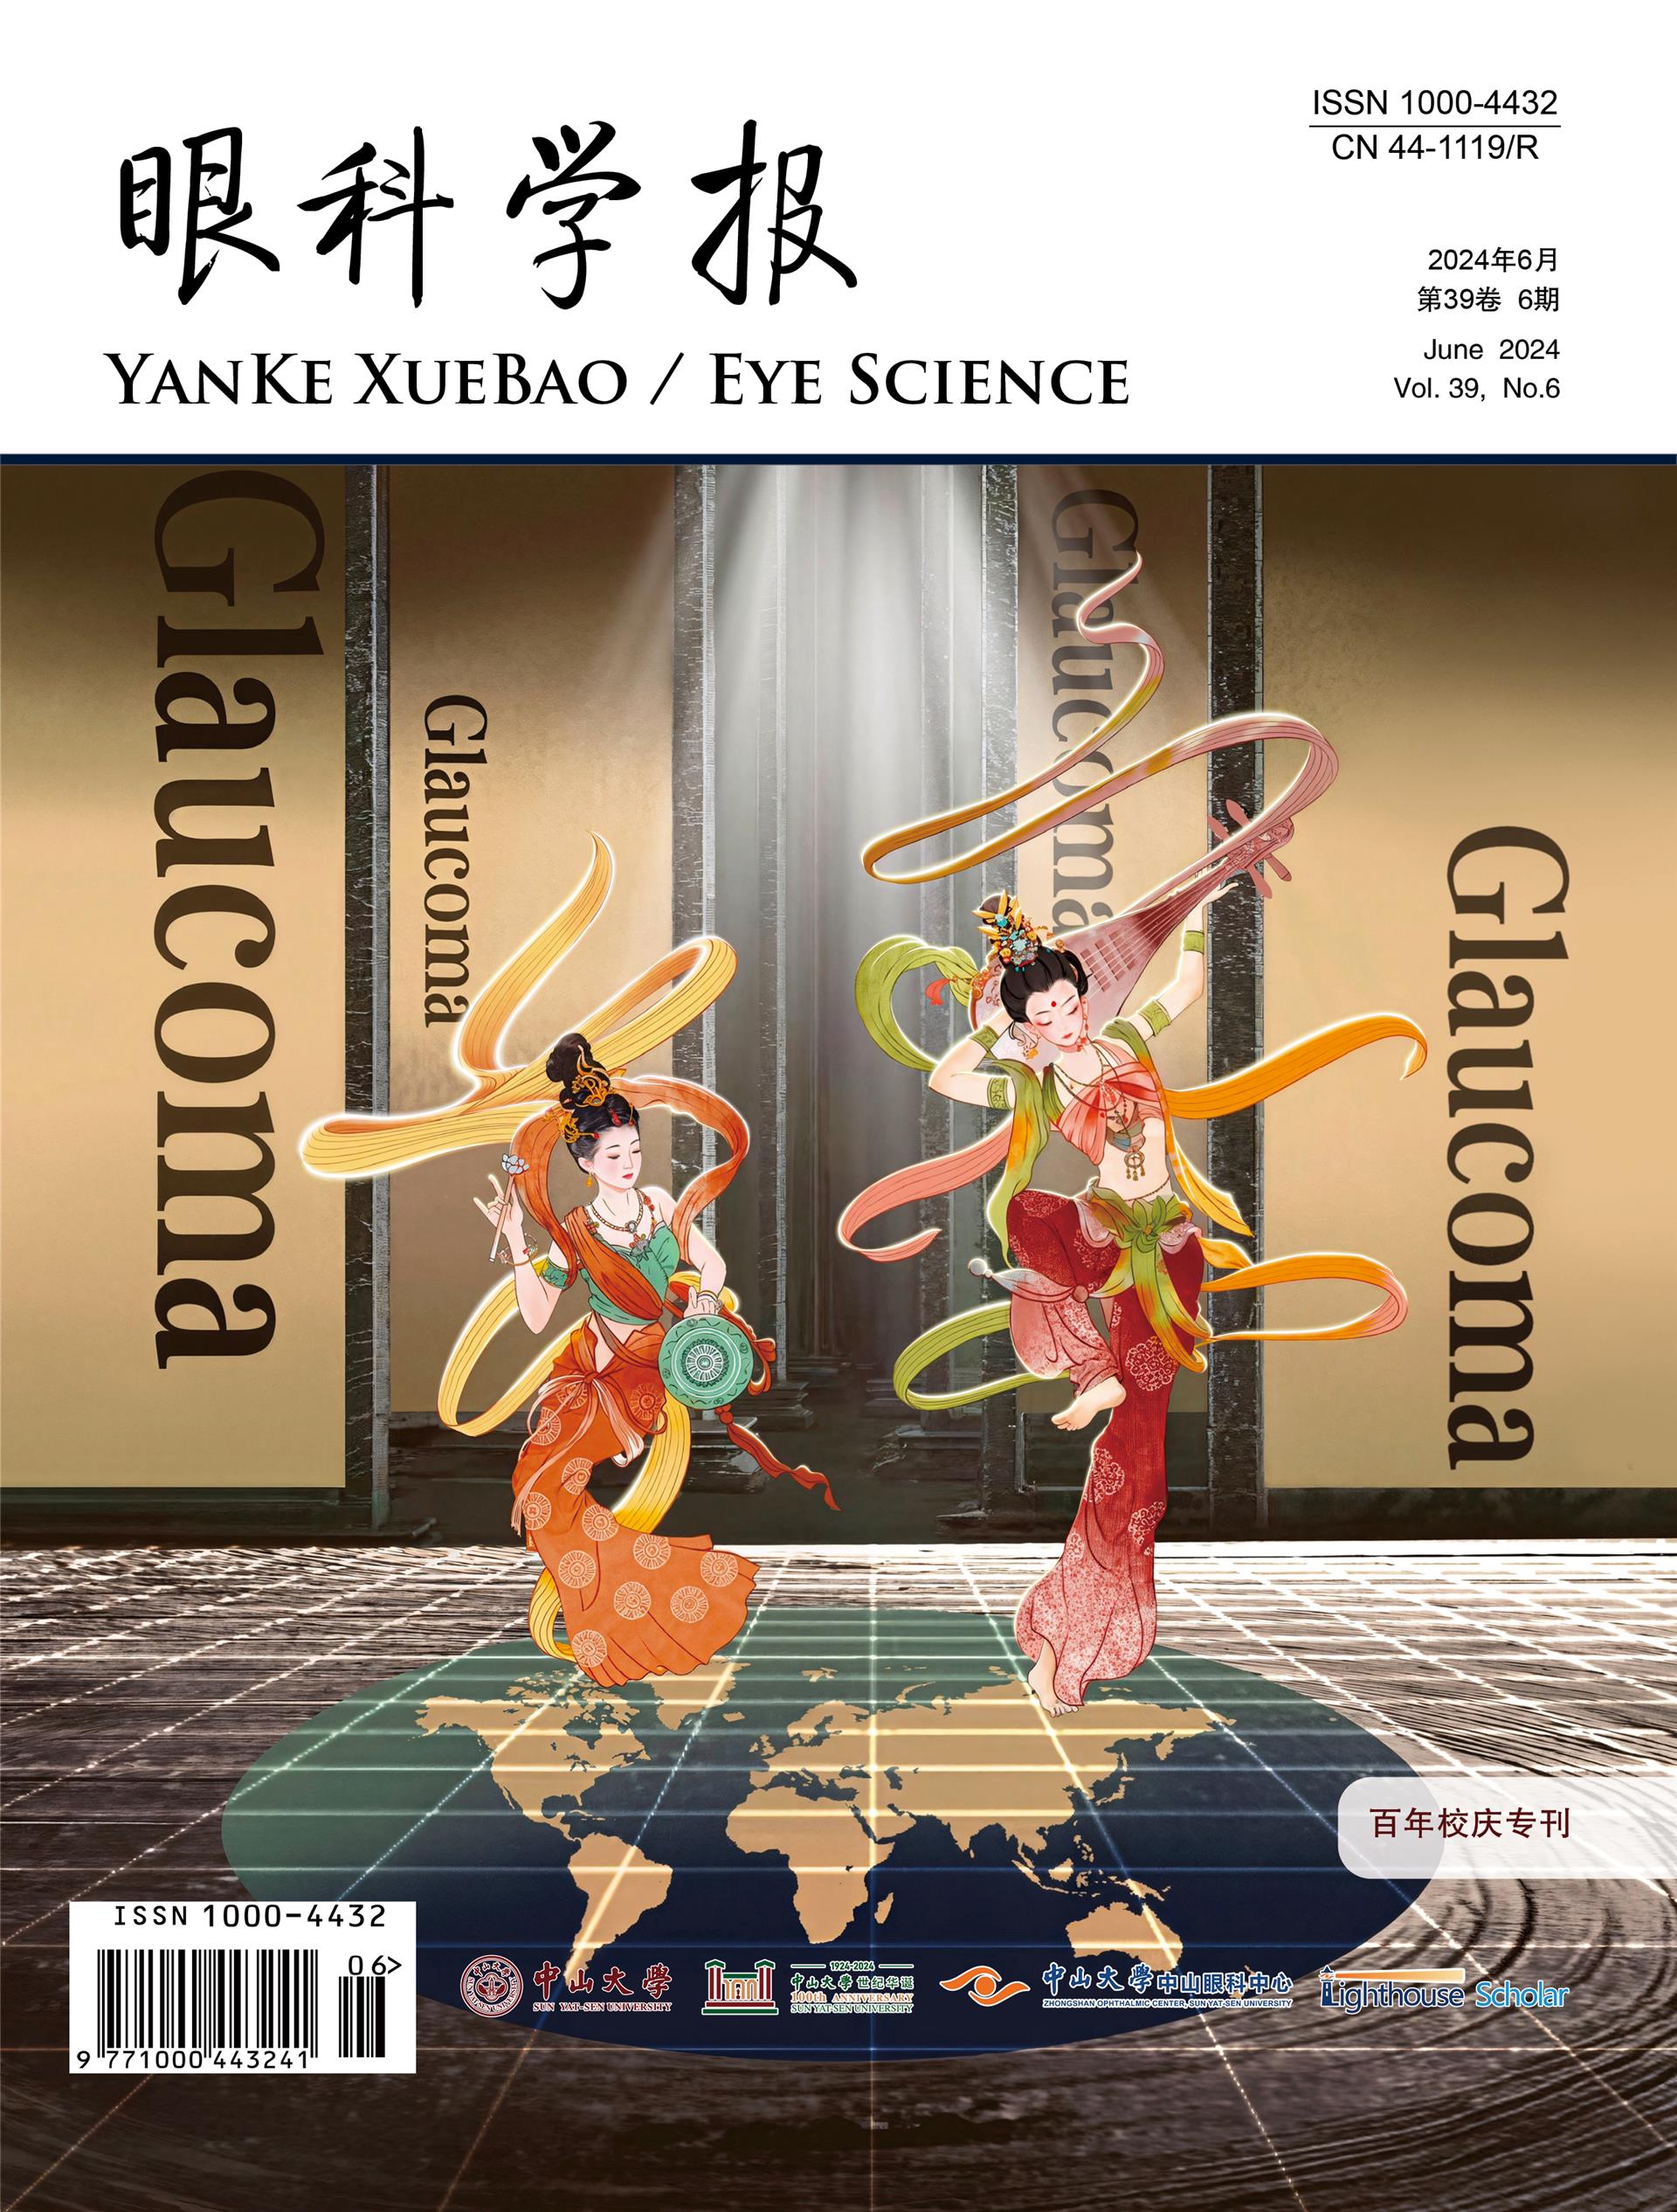
Before the era of OCT, more conventional imaging modalities were used to detect buried ODD, with varying degrees of sensitivity (Figure 1). B-scan orbital ultrasonography was, for many years, considered the gold-standard modality for ODD evaluation and shown to be more reliable than other contemporaneous modalities, such as fundus autofluorescence imaging or high-resolution orbital computed tomography (CT) (11). For example, in one study of 82 eyes with suspected ODD, autofluorescence detected ODD in 15 eyes, while ultrasonography detected ODD in 39 (and did not miss any of the ODD detected by FAF or by CT) (11).
The first report of OCT in the evaluation of ODD was published in 1998 (12), and showed that, compared to age-matched controls, patients with ophthalmoscopically visible ODD had significant thinning of the peripapillary retinal nerve fiber layer (RNFL) on time-domain OCT. This report also included the first OCT image of an ODD, visible as a signal-poor (dark) deposit within the optic disc, causing elevation of the optic nerve head (12). With the advent of spectral-domain OCT (SD-OCT) in the mid-2000s, scanning time decreased and image resolution increased remarkably; SD-OCT could not just detect ODD, but could pinpoint their location, shape, volume, and number with newfound accuracy (13). The appearance of ODD on SD-OCT was initially described as one of a signal-poor core with a hyperreflective anterior border, like a superficial “cap” (13,14); however, even after this important imaging advance, the posterior borders of ODD and deeper structures in the prelaminar optic nerve remained indistinct or invisible using first-generation SD-OCT techniques, owing to poor penetrance.
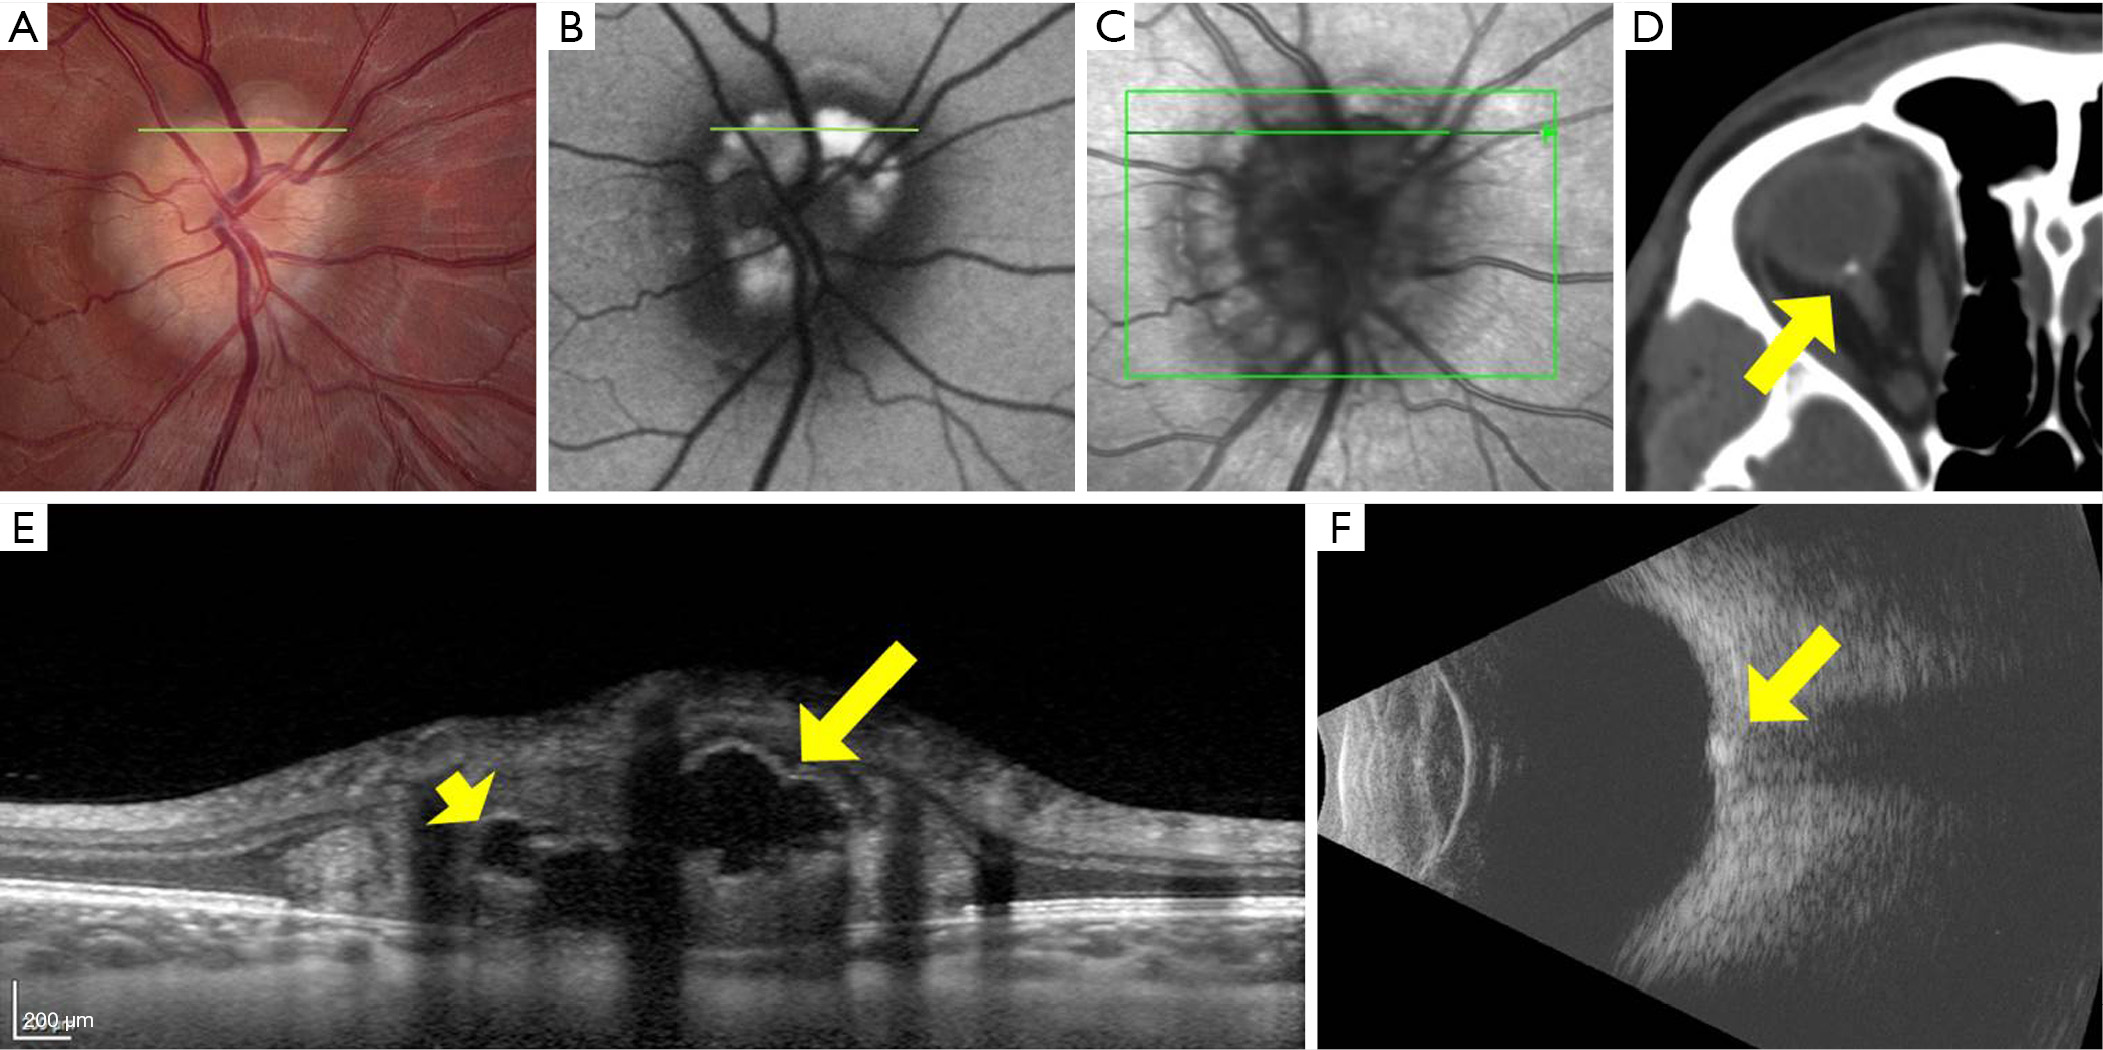
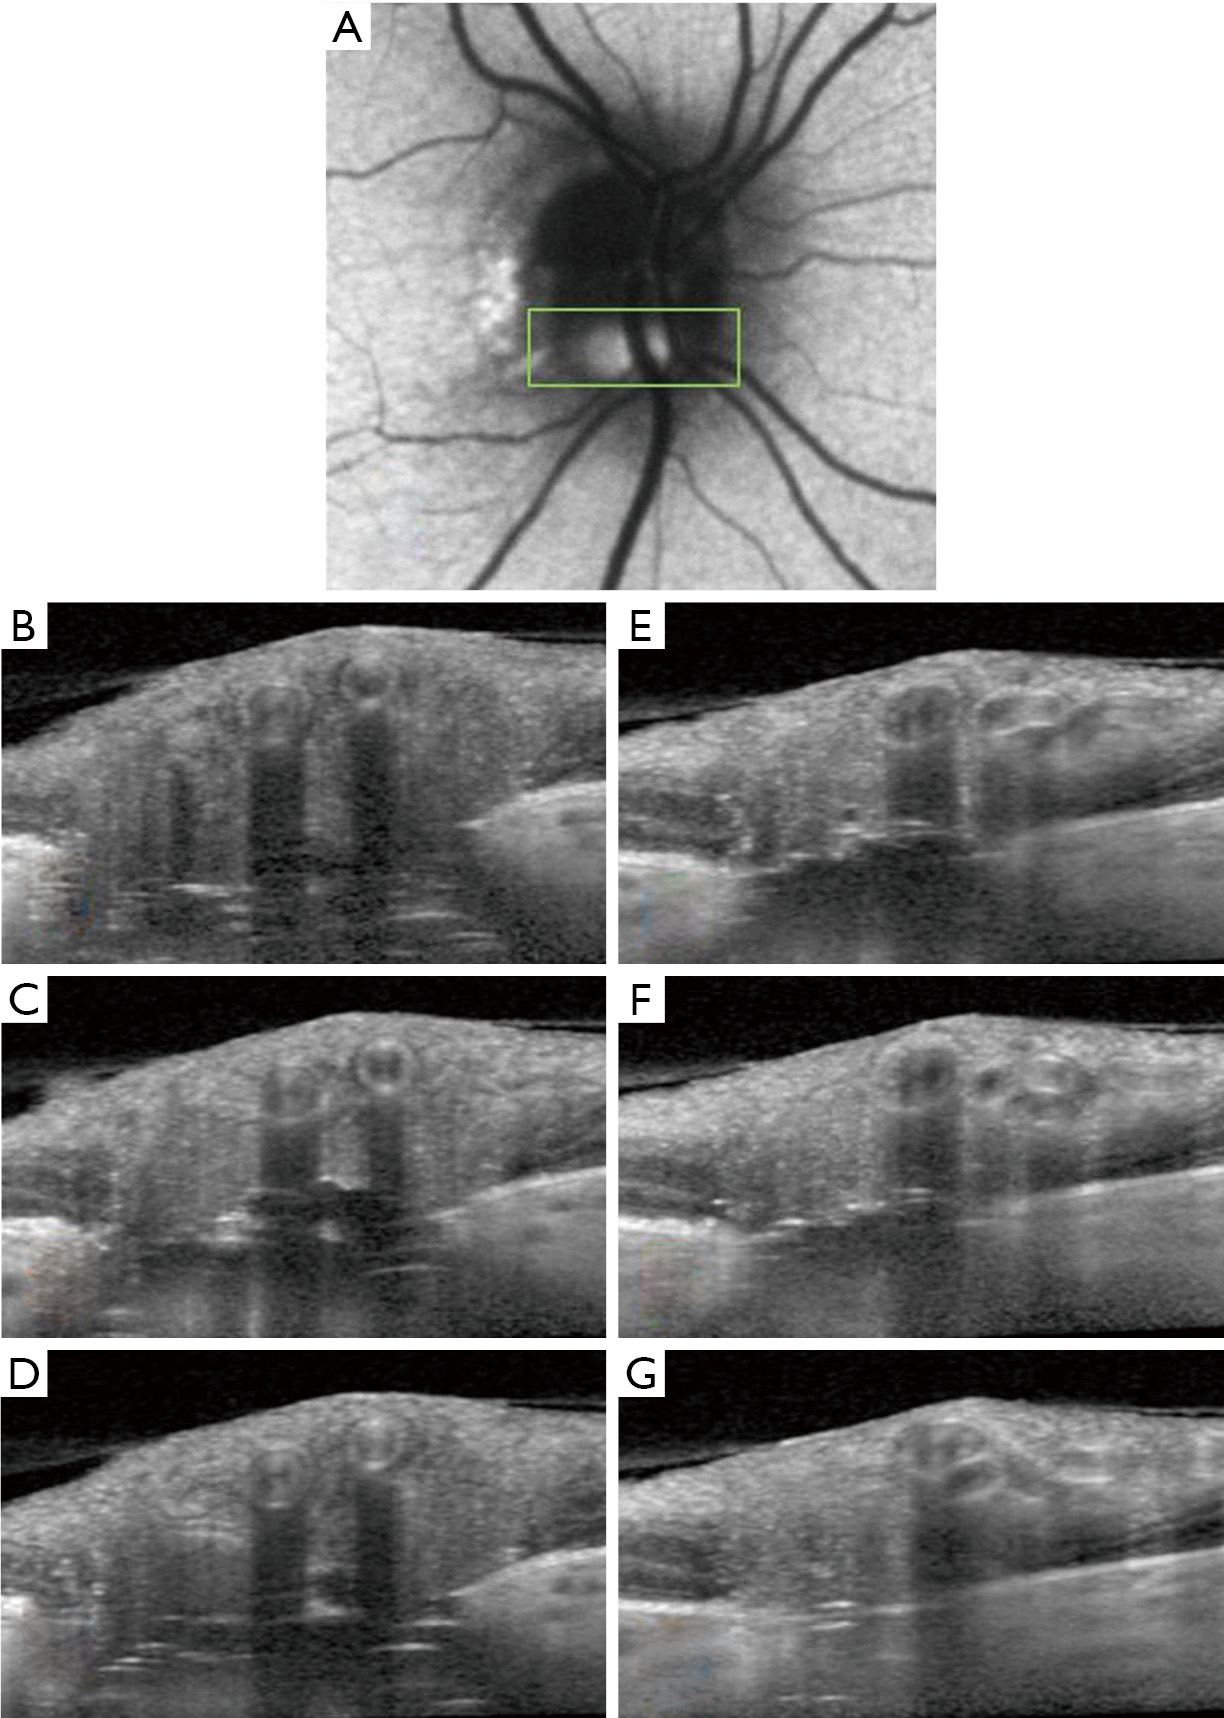
Two subsequent developments independently allowed deeper penetration of optic disc tissue and better visualization of ODD posterior borders; the first was enhanced-depth-imaging OCT (EDI-OCT), and the second was swept-source OCT (SS-OCT) (15,16). EDI-OCT is a modification of standard SD-OCT technique, that shifts the coherence gate of the OCT apparatus to deeper structures in the eye, enhancing their visibility and resolution (17). While EDI-OCT can be performed using a standard SD-OCT machine (containing a low-coherence broad-bandwidth light source), SS-OCT requires a high-coherence laser light source that can sweep across different wavelengths, and therefore necessitates different equipment. Because longer wavelengths of light are used in SS-OCT than standard SD-OCT, deeper penetration of ocular tissue is possible without scatter (15). Both EDI-OCT and SS-OCT can penetrate to the level of the lamina cribrosa, much deeper than the limit of standard SD-OCT, and appear equally suited to imaging the hyperreflective posterior borders of ODD and more deeply buried ODD (Figure 2) (15,16). Software algorithms can now be used to calculate ODD volumes based on SS-OCT (18) or EDI-OCT (19,20) data and even render 3-dimensional rotatable visual representations of ODD.
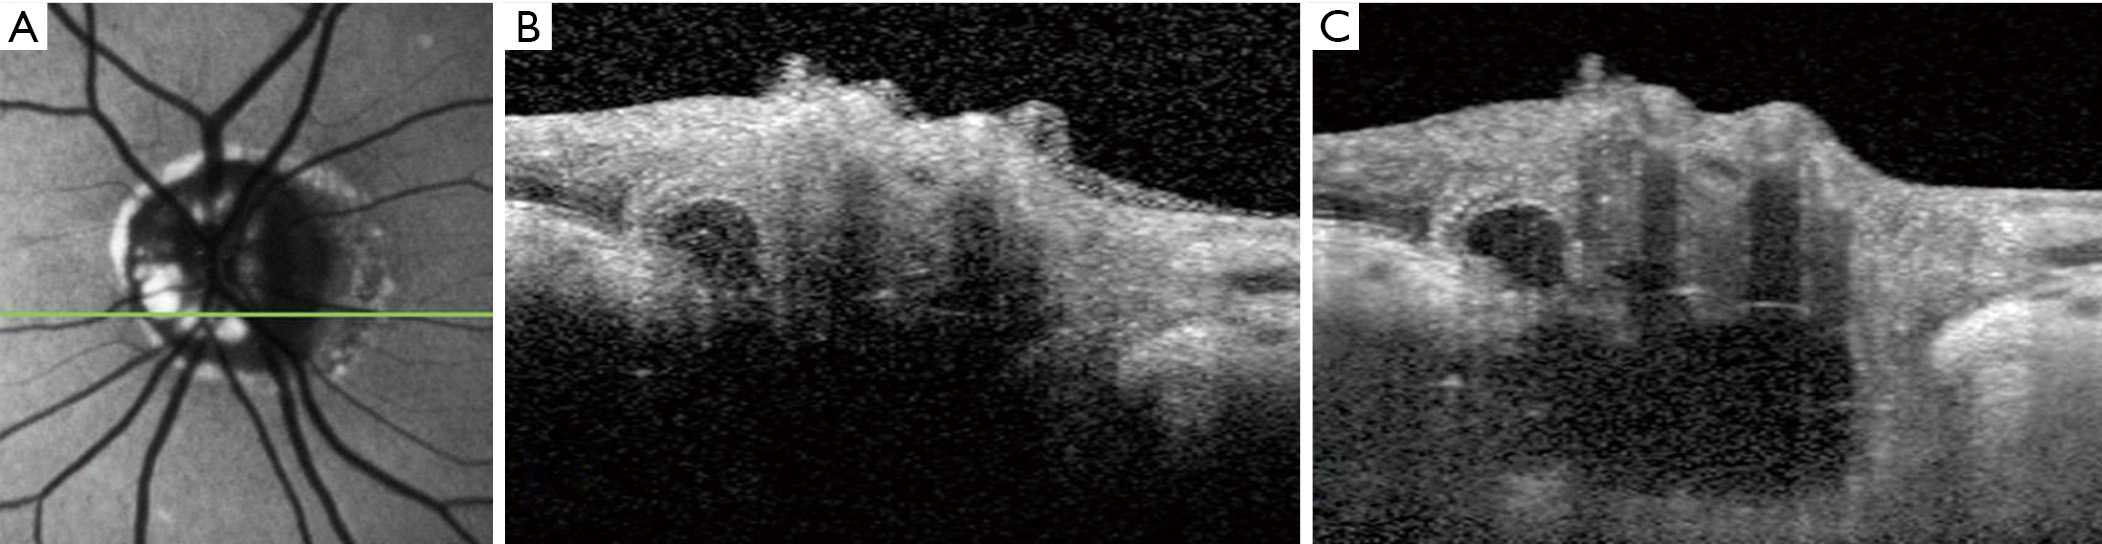
In an influential 2013 study, Merchant and colleagues prospectively compared EDI-OCT to non-EDI SD-OCT and B-scan orbital ultrasound in a series of 68 eyes (32 with definite superficial ODD on ophthalmoscopy, 25 with suspected buried ODD, and 11 normal-appearing optic discs) (21). The EDI-OCT correlate of a definite superficial ODD was, in all cases, a rounded mass with a signal-poor core, surrounded by short hyperreflective bands perpendicular to the OCT beam (Figure 3). All such eyes also had isolated or clustered hyperreflective bands without an associated signal-poor core elsewhere in the optic disc. Taking these features to be the OCT “signatures” of ODD, the authors identified ODD in 17 of the 25 suspected ODD cases on EDI-OCT (vs. 14 for non-EDI-OCT and vs. 7 for B-scan orbital ultrasound), and 3 of the 11 normal cases on EDI-OCT (vs. 1 for non-EDI-OCT and vs. 1 for B-scan orbital ultrasound). Overall, the authors found that EDI-OCT was superior to the other modalities: it detected ODD more often than non-EDI-OCT or B-scan orbital ultrasound, and it did not miss any of the ODD detected by these other modalities. In a later study, EDI-OCT was also found to be superior to fundus autofluorescence imaging at detecting ODD, particularly smaller or more deeply buried ODD (22).
Although OCT can be used to image ODD directly, it can also be used to assess their indirect influence on other structures in the retina. RNFL thickness, a surrogate for axonal integrity within the optic nerve, has been a consistent target of OCT measurement since the first time-domain OCT publications of the late 1990s, and has repeatedly shown attenuation correlating with increased ODD size and superficiality on time-domain OCT (12,23,24) and SD-OCT (19,24-26). This attenuation was not evident in a cohort of children with ODD, suggesting that loss of RNFL thickness occurs as a result of damage over time (27). One advantage of OCT (and RNFL analysis in particular) over traditional modalities for ODD assessment is the ability to correlate ODD burden with degree of neuroaxonal injury or functional correlation with visual outcomes. Moreover, structural and quantitative analysis of ODD by OCT allows for correlation of clinically relevant measures of visual function over time.
Macular ganglion cell-inner plexiform layer (GCIPL) OCT has also shown thinning corresponding to ODD severity (25). Because GCIPL thinning seems to correlate with the presence of deeper ODD better than RNFL thinning does, GCIPL analysis may be better for detecting earlier structural damage associated with deeply buried ODD than RNFL analysis (25).
OCT angiography (OCT-A) is a novel means of imaging the microvasculature of the retina and segmenting it by layer. Unlike fluorescein angiography, it is non-invasive and can achieve micrometer precision, but has not been widely studied in ODD. Central retinal vascular anomalies, including cilioretinal arteries, retinochoroidal collateral vessels, increased vascular tortuosity and early branching, are frequently associated with ODD (28,29). OCT-A is a promising modality to better characterize these differences. In one report of a patient with superficial ODD, OCT-A showed focal loss of capillaries in the superficial laminar segment overlying the most prominent ODD, in addition to a focal thinning of the RNFL corresponding to the distribution of the ODD (30). A subsequent study of 19 eyes with ODD showed lower flow index and vessel density on OCT-A compared to normal eyes. These OCT-A abnormalities were found to correlate with GCIPL abnormalities, but not with RNFL parameters (31).
In 2018, the Optic Disc Drusen Studies (ODDS) Consortium published “Recommendations for Diagnosis of ODD using OCT” in an effort to standardize the OCT diagnosis of ODD (32). This international working group of experts published their consensus regarding the OCT acquisition and diagnosis of ODD. Reviewing the literature, the consortium came to the opinion that EDI-OCT was to be considered the most reliable imaging method for assessing ODD. The consortium outlined the recommended acquisition protocol to achieve standardization for future research (Table 1). Then, using an iterative multi-step review process of 74 individual EDI-OCT data sets, the group agreed on OCT features diagnostic of ODD as well as common artifacts that they thought should not be considered indicative of ODD.
| Acquisition |
| Dilate pupils before examination if necessary |
| Use SD-OCT in EDI mode |
| If no SD-OCT is available, adjust the distance from the OCT apparatus to the eye to get an inverted view of the optic nerve head for better visualization of deeper structures |
| Dense optic nerve head scan |
| Select high-resolution acquisition if possible |
| Centre a scan area of 15° × 10° over the optic disc |
| Scan with 97 sections in that area (30 μm between each scan) |
| Average at least 30 frames |
| Perform the volume scan in both horizontal and vertical directions |
Adapted with permission from Malmqvist
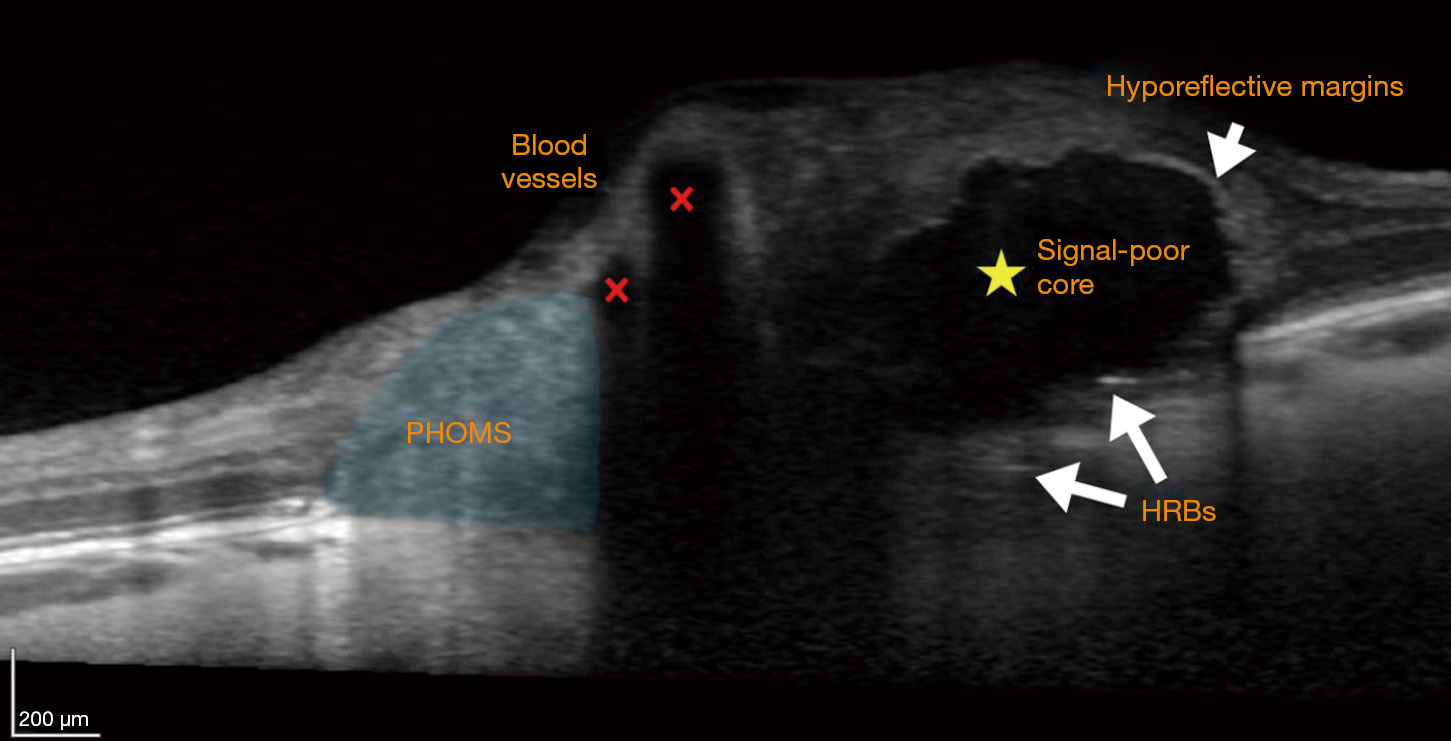
The ODDS Consortium reached a consensus to define ODD as “hyporeflective structures with a full or partial hyperreflective margin” (Figure 3) (32), in keeping with most of the previously published OCT studies. The hyporeflective, signal-poor, core of an ODD is a result of its uniform index of refraction and lack of reflective internal optical interfaces. The hyperreflective outer margins demarcate the sharp optical interface between an ODD and neighboring tissue. Earlier work using non-EDI SD-OCT showed an anterior “cap” sign, initially believed to represent the nidus of calcification from which ODD arise (14). Subsequent EDI-OCT studies have shown that each ODD is enveloped in an outer jacket of hyperreflectivity, even along its posterior border, with an EDI-OCT appearance reminiscent of a dark egg. The apparent “cap” sign anteriorly was simply an artefact of insufficiently deep optical penetration by earlier-generation OCT techniques (Figure 2) (16,21).
ODD, when they are detected, are always visualized anterior to the lamina cribrosa (21,32). The leading theory of ODD pathogenesis holds that, in the small scleral canals of ODD patients, the lamina cribrosa acts as a “choke point” for axoplasmic transport, resulting in calcium build-up within intra-axonal mitochondria. These mitochondria are subsequently extruded into the extracellular space proximal to the obstruction, i.e., anterior to the lamina cribrosa, where they act as niduses for runaway calcium deposition, ultimately growing into ODD (1).
An eye may have only a single ODD, or multiple ODD, and these can be situated at differing depths between the lamina cribrosa and the optic disc surface; ODD may sometimes form conglomerations with other ODD to create more complicated, multilobed, structures (Figure 4).
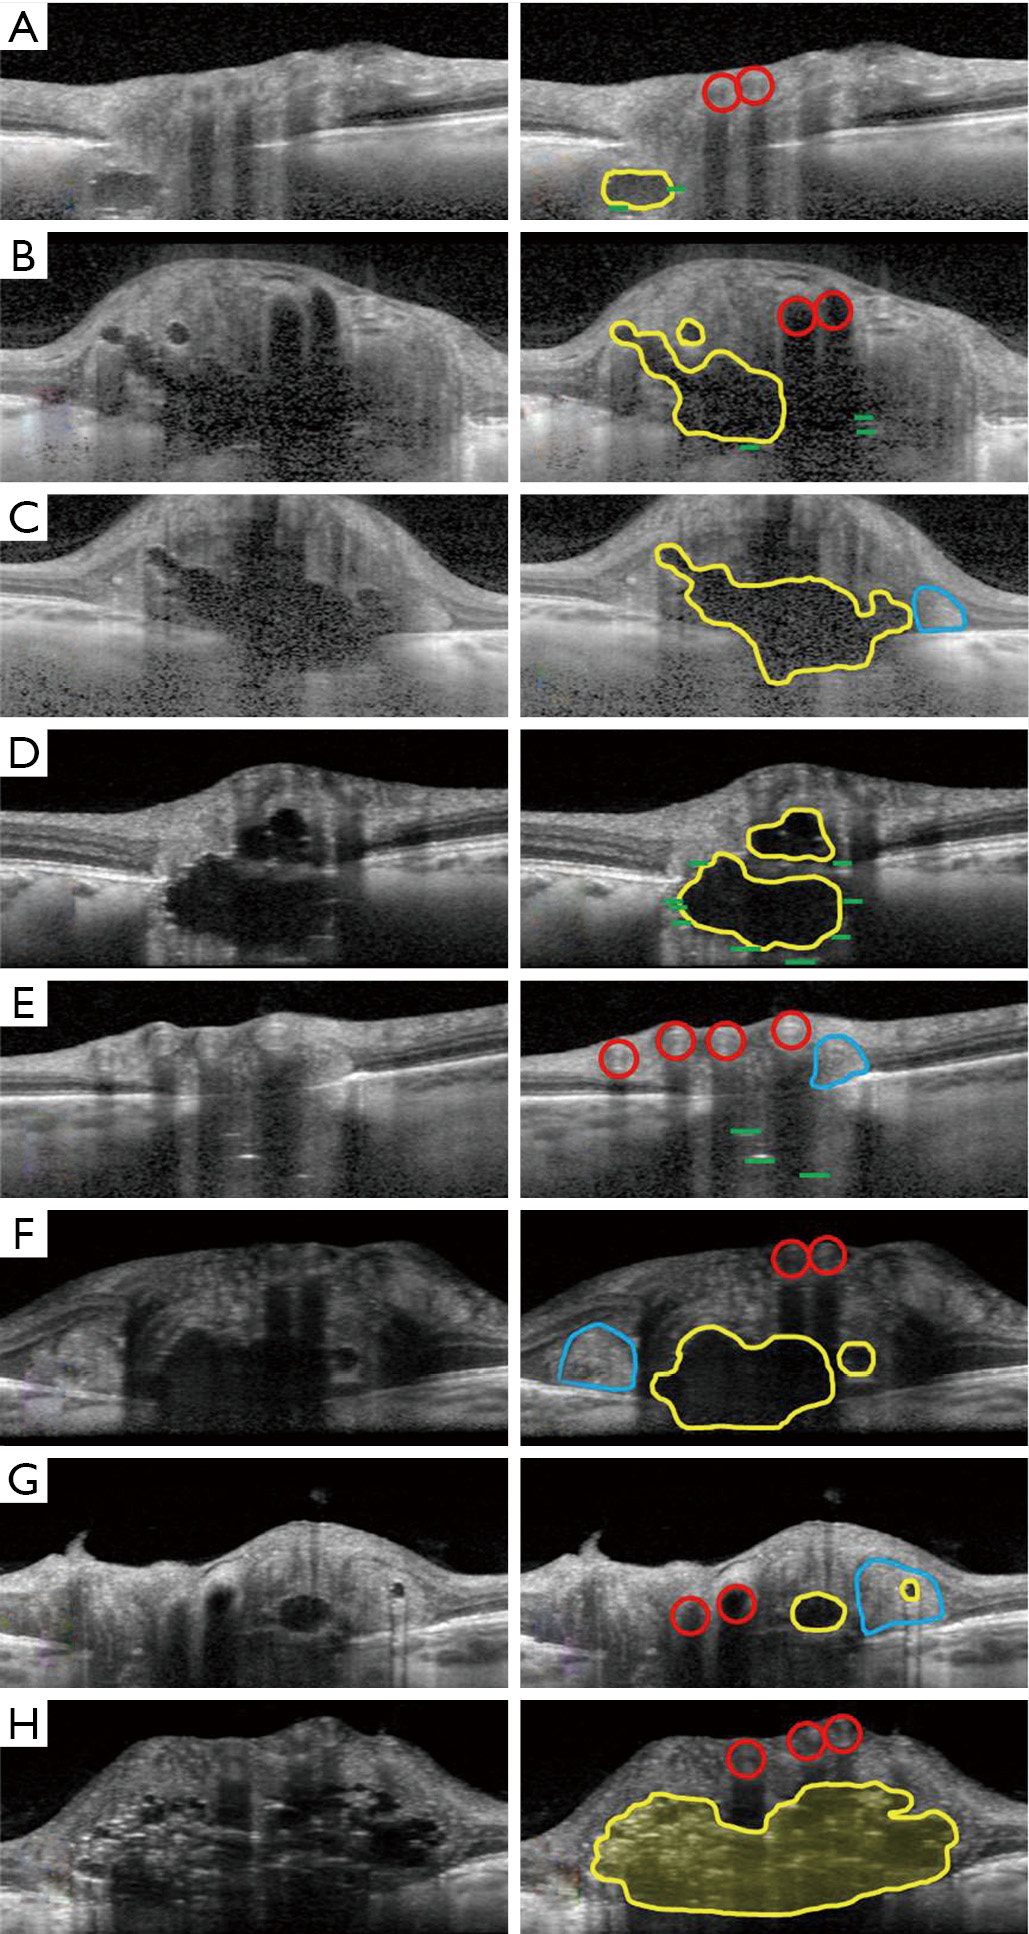
Although the hyporeflective cores of ODD are invariably associated with hyperreflective bands (21), it is not yet clear what isolated hyperreflective bands (without an associated hyporeflective core) may represent. Hyperreflective bands on a single OCT slice may only seem isolated until their parent ODD is detected on an adjacent OCT section (Figure 5). When truly isolated hyperreflective bands are seen, however, they are always situated deep in the optic nerve head between the lamina cribrosa and Bruch’s membrane, in a region where OCT image detail becomes degraded (Figure 4E). Some researchers have theorized that isolated hyperreflective bands may represent nascent ODD, that have not yet grown to the number or size required to form a fully mature ODD (21). These hyperreflective bands do not seem to be an imaging artefact, because they persist in their location and extent when the EDI-OCT scanning protocol is altered (21,33). Nevertheless, the ODDS Consortium has recommended, for now, that isolated hyperreflective bands not be considered to be ODD without histopathological proof (32). In one study of clinically normal subjects (33), the prevalence of isolated hyperreflective bands reached 14.6%, far exceeding the 2% reported histopathological prevalence of ODD in the general population. Unlike more definite ODD, isolated hyperreflective bands are stereotyped, short, oriented perfectly perpendicular to the OCT beam, and often clustered together in a vertical stack. It is not clear whether isolated hyperreflective bands are also evident on SS-OCT, as there has only been one study comparing EDI-OCT to SS-OCT, in which isolated hyperreflective bands were not specifically examined (16). All authors studying these isolated hyperreflective bands have stressed the need for histopathological confirmation of what they may truly represent (6,21,32,33).
Patients with ODD on EDI-OCT have sometimes also been observed to have peripapillary hyperreflective ovoid mass-like structures (PHOMS) (Figures 3,4C,E,F,G). While some researchers have argued that these structures may represent superficial, early, or atypical ODD (34,35), the consensus now is that PHOMS are actually common EDI-OCT mimics of ODD, rather than true ODD (32). Various lines of evidence refute the theory of PHOMS being ODD: PHOMS do not autofluorescence; they are not visible on B-scan orbital ultrasonography; they are not visible on ophthalmoscopy despite their superficial location, except perhaps as pseudopapilledema; they are hyperreflective unlike all other ODD; and they are located in the peripapillary region of the disc, sometimes forming a “donut” shape around the optic disc. PHOMS are not unique to patients with true ODD; PHOMS have been found in papilledema from active idiopathic intracranial hypertension (and disappear when the papilledema resolves), anterior ischemic optic neuropathy, central retinal vein occlusion, papillitis, and even high myopia (36). Furthermore, histopathological studies of papilledema (1,13,37) and ODD (1,3,10) have shown bulging or herniation of distended axons laterally into the regions where PHOMS are typically seen. Although their prominence and ovoid shape on OCT may misleadingly suggest ODD, PHOMS are now believed simply to be a nonspecific marker of axonal distention and crowding (6,36,38,39).
Another common mimic of ODD encountered with OCT are normal retinal blood vessels. Blood vessels appear in the inner, superficial layers of the optic disc and cast shadows on deeper structures (Figures 3,4A,B,E,F,G,H). Though the vessel interior may not be signal-poor to the same extent as ODD, the vessel has hyperreflective anterior and posterior borders, and can appear oval and drusenoid when imaged in cross-section (Figure 4G). Unlike ODD, blood vessels have paired hyperreflective bands (anterior and posterior) and not clustered ones, and the arteriole-venule pair often forms a distinctive “figure of eight” configuration in cross-section (Figure 4A,B,F,H). It is usually not difficult to distinguish a long tubular blood vessel from a discrete lumpy ODD deposit by simply scrolling through consecutive cross-sectional OCT images in order to grasp a structure’s 3-dimensional extent (Figure 5) (32).
ODD are frequently buried and non-calcified in children, hampering detection via ophthalmoscopy, ultrasonography, FAF and CT scan (40). In these cases, EDI-OCT may be able to detect ODD earlier and more reliably than other modalities. It is unclear whether ODD are congenital or if they occur at an early stage of childhood. ODD have been detected in patients as young as age 4 (41), but two case reports of children followed for ODD noted normal appearing optic discs prior to presentation (42,43). In one case, elevated optic discs were found incidentally at age 8, with documentation of normal optic discs at age 4. Superficial ODD became visible at age 11 (43). In the second case, the optic discs were reported as unremarkable at age 2, but appeared elevated on routine follow up at age 5. No calcification was seen on CT at that time, but repeat CT at age 8 demonstrated calcification consistent with buried ODD. The ODD became visible on ophthalmoscopy in one eye at age 12 and the other at age 21 (42).
The Copenhagen Child Cohort 2000 Eye Study detected ODD in 1.0% of children age 11–12 using EDI-OCT. An additional 0.8% of subjects were found to have hyperreflective bands, but were not considered to have definite ODD (44). Follow up data on this same cohort at age 16–17 detected ODD in 2.2% of re-examined children (45). This is higher than the previously reported prevalence in children of 0.37%, based on ophthalmoscopy alone (46), reflecting the improved detection rate of OCT. The updated prevalence is also strikingly similar to that reported in adult histopathologic studies (1.8–2.0%) (3,10), although no equivalent cross-sectional study using EDI-OCT has been conducted in an adult population.
Buried ODD may be difficult to differentiate from true optic disc edema on funduscopy, particularly in young children with limited cooperation. Early identification of ODD can prevent unnecessary, expensive, and invasive testing during investigation for papilledema. In one study, 19 of 34 children referred for papilledema were eventually diagnosed with ODD (47). When EDI-OCT is not available to allow direct visualization of ODD, non-EDI-OCT may provide clues to differentiate true optic disc edema from pseudoedema. RNFL analysis has demonstrated increased thickness in optic disc edema versus ODD (19,24,25), particularly nasally (48), although this is controversial (49). Normative values vary between manufacturers and devices, limiting the use of RNFL analysis as a diagnostic technique on individual patients. Thompson et al. found Bruch’s membrane opening (BMO) to be smaller in eyes with ODD than papilledema (1,542 vs. 1,894 μm) in a pediatric cohort (50). Children from the Copenhagen Child Cohort 2000 Eye Study with ODD also had a narrower scleral canal opening compared with controls (1,339 vs. 1,508 μm) (51). Again, a device-specific normative database would be required to use this as a diagnostic tool for individual patients. Furthermore, an adult study demonstrated larger scleral canal size in ODD eyes compared to controls (2,520 vs. 1,832 μm) (52). It is possible that the growth of ODD over time could cause outward displacement of Bruch’s membrane, leading to larger measurements of scleral canal size in adults (27). Therefore, scleral canal size may only be useful in differentiation of ODD from optic disc edema in children.
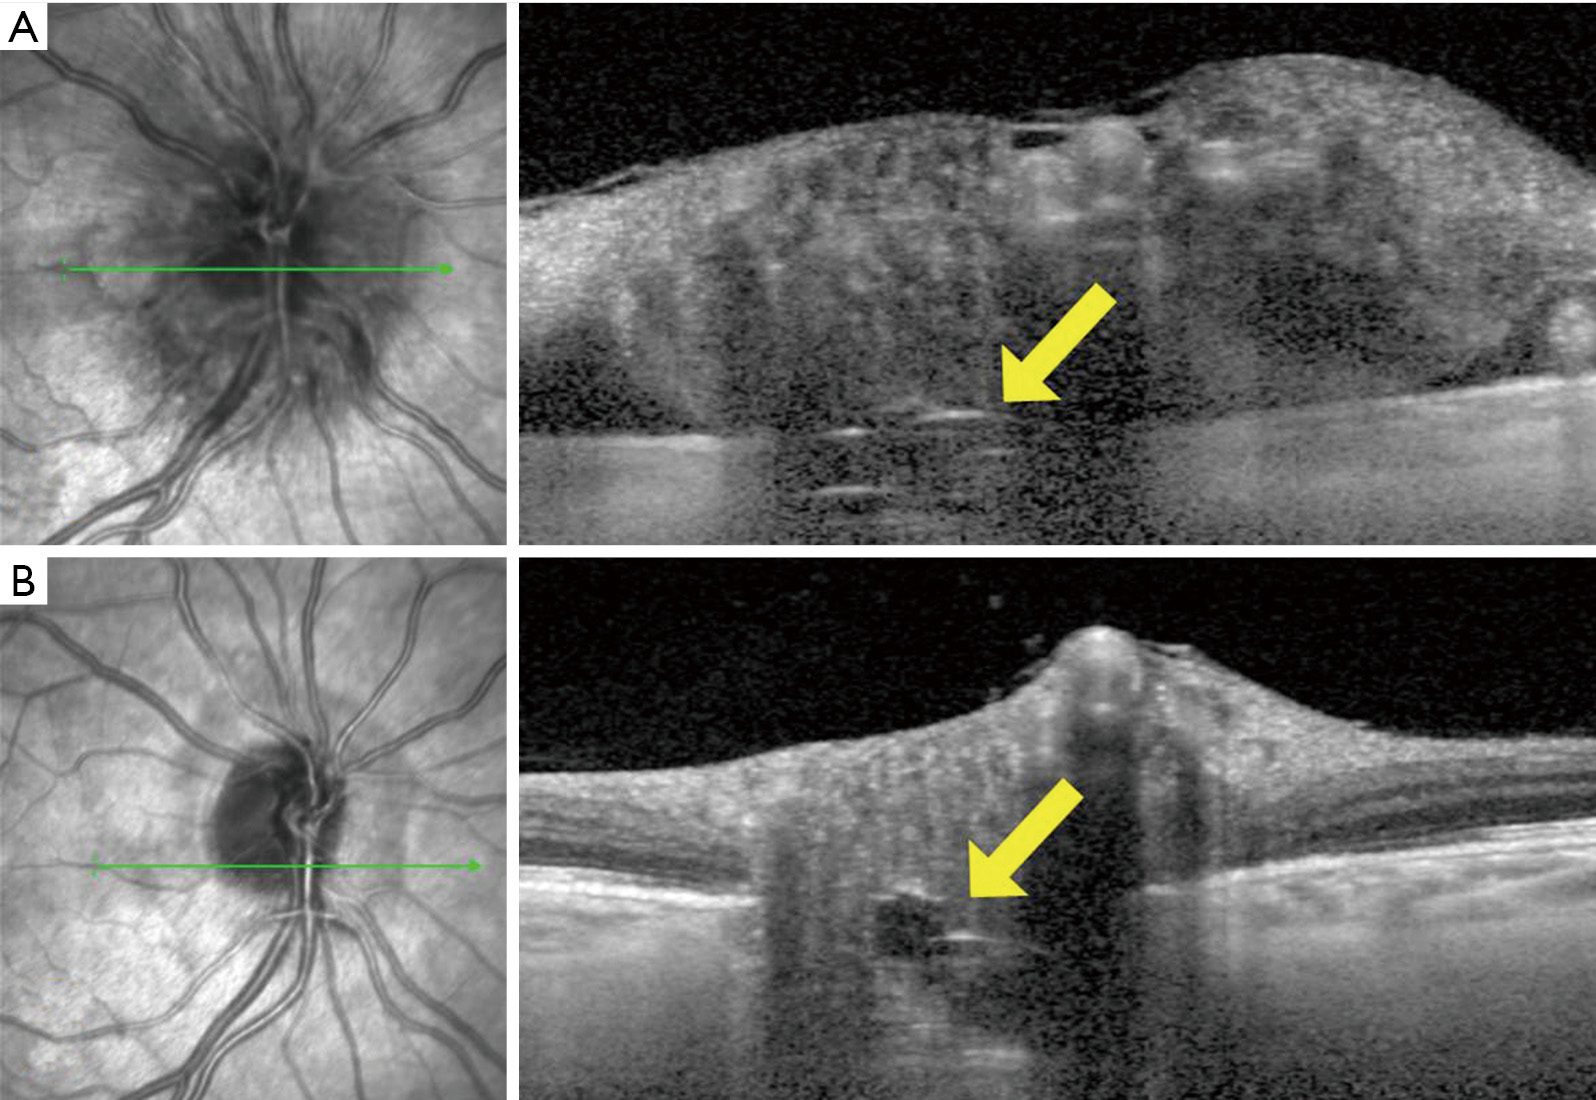
ODD are associated with retinal vascular complications, including choroidal neovascular membrane (CNVM), retinal vein occlusion and retinal artery occlusion (40,53). CNVMs associated with ODD tend to be juxtapapillary, occur more frequently in children, and have a good prognosis without treatment (7,53). ODD are also known to be associated with non-arteritic ischemic optic neuropathy (NAION) (54). In a retrospective review of 119 patients with NAION, the presence of bilateral ODD was found to be a significant risk factor for fellow eye involvement in younger patients (hazard ratio 2.78) (55). In patients presenting with NAION without systemic vascular risk factors, EDI-OCT can be used to investigate for ODD, both to help define the etiology and prognosticate risk to the fellow eye. ODD are detectable in the acute phase of optic disc edema, but may become more easily recognizable once the edema has resolved (Figure 6).
Several case reports and one case series have followed patients with ODD for between 16 and 56 years (42-44,51), demonstrating the gradual change in ODD from buried to superficial and non-calcified to calcified (42-44). Once the ODD became superficial, there was no documented change in the number and size of visible ODD over a median of 56 years in 8 patients (51). The transition from buried to superficial ODD appears to occur in the first 2 decades of life, with no documented visible progression beyond age 16 in these reports (27,42-44). In a study of 50 children with ODD, 18% were visible in children age 7–10 and 37% were visible in children age 11–14 (46). Despite the lack of visible change, Malmqvist and colleagues documented progression of visual field loss, with a decrease in the area on Goldman perimetry by 27% with size 5 stimulus (6 eyes) and by 45% with size 1 stimulus (7 eyes) over 56 years (44). This progressive visual field loss could be related to continued axonal compression, but change in the non-visible ODD cannot be excluded as there are no long term studies using EDI-OCT to determine whether deeper ODD change over time. In one study, superficial ODD were shown to correlate with visual field defects and RNFL thinning more than buried ODD (26).
Because only a fraction of ODD are visible on ophthalmoscopy, particularly in children, advanced optic disc imaging is often necessary to detect ODD. As there is currently no known treatment or prevention for ODD, the primary clinical utility of diagnosing ODD is to rule out other more dangerous causes of optic disc elevation. EDI-OCT is emerging as the single best imaging modality to evaluate ODD, and has a detection rate approaching that of cadaveric histopathological studies (10,45). Where it has been studied in comparison to other modalities, EDI-OCT detects cases of ODD missed by other modalities and does not miss cases picked up by these other modalities (21,22). In particular, EDI-OCT seems to surpass the existing gold standard of B-scan orbital ultrasound in its ability to detect ODD, and its extraordinarily high spatial resolution confers an added ability to determine the location, number, volume, and shape of ODD, even when small and deeply buried.
Visible ODD do not appear to change in adulthood, but little is known about the long-term stability of buried ODD. The association between hyperreflective bands and ODD is not yet confirmed, but promising data is being generated through longitudinal imaging. EDI-OCT has become the most important biomarker for evaluation and management of ODD with the potential to better understand when and how ODD form, and the mechanism underlying vision loss.