您的位置: 首页 > 2024年12月 第1卷 第4期 > 文字全文
2023年7月 第38卷 第7期11
目录

Regression of choroidal neovascularization often precedes macular atrophy in eyes with neovascular age-related macular degeneration treated with vascular endothelial growth factor neutralizing proteins

Regression of choroidal neovascularization often precedes macular atrophy in eyes with neovascular age-related macular degeneration treated with vascular endothelial growth factor neutralizing proteins

来源期刊: Eye Science | 2024年12月 第1卷 第4期 261-278 发布时间:2024-11-28 收稿时间:2024/12/13 9:18:11 阅读量:102
作者:
关键词:
Macular atrophy Wet AMD Neovascular AMD Anti-VEGF
DOI:
10.12419/es24072501
Received date:
2024-07-15 
Accepted date:
2024-10-16 
Published online:
2024-11-28 
Aims: To identify incident macular atrophy and evaluate antecedent anatomic alterations in eyes with neovascular age-related macular degeneration (NVAMD) that were treated with anti-vascular endothelial growth factor (anti-VEGF) agents. Methods: All patients treated with anti-VEGF agents for NVAMD by one of the authors during the 2014 calendar year who had follow up ≥ 12 months had evaluation of all SD-OCT scans from first treatment (usually prior to 2014) to last follow up through June 2018. Results: The ascertainment procedure identified 342 eyes of 278 patients with NVAMD among which 47 developed macular atrophy. The median time from treatment initiation to development of macular atrophy was 29.6 (interquartile range, 17.7-43.4) months. Three macular alterations were identified in areas that developed atrophy (some eyes had more than one); collapse of a vascularized pigment epithelial detachment (PED) and regression of choroidal neovascularization (CNV) in 25 eyes, development of subretinal hyper-reflective material and/or subretinal fibrosis in 15 eyes, or atrophy occurring in association with large drusen and pigmentary changes resulting in an arc of atrophy in a pattern typically referred to as geographic atrophy in 13 eyes. Conclusions: These data suggest that in some instances CNV may compensate for choroidal ischemia and the loss of CNV may expose retinal pigmented epithelial cells and photoreceptors to ischemic damage and atrophy.
Aims: To identify incident macular atrophy and evaluate antecedent anatomic alterations in eyes with neovascular age-related macular degeneration (NVAMD) that were treated with anti-vascular endothelial growth factor (anti-VEGF) agents. Methods: All patients treated with anti-VEGF agents for NVAMD by one of the authors during the 2014 calendar year who had follow up ≥ 12 months had evaluation of all SD-OCT scans from first treatment (usually prior to 2014) to last follow up through June 2018. Results: The ascertainment procedure identified 342 eyes of 278 patients with NVAMD among which 47 developed macular atrophy. The median time from treatment initiation to development of macular atrophy was 29.6 (interquartile range, 17.7-43.4) months. Three macular alterations were identified in areas that developed atrophy (some eyes had more than one); collapse of a vascularized pigment epithelial detachment (PED) and regression of choroidal neovascularization (CNV) in 25 eyes, development of subretinal hyper-reflective material and/or subretinal fibrosis in 15 eyes, or atrophy occurring in association with large drusen and pigmentary changes resulting in an arc of atrophy in a pattern typically referred to as geographic atrophy in 13 eyes. Conclusions: These data suggest that in some instances CNV may compensate for choroidal ischemia and the loss of CNV may expose retinal pigmented epithelial cells and photoreceptors to ischemic damage and atrophy.

HIGHLIGHTS

• Previous studies have proposed a few risk factors for development of macular atrophy among patients receiving anti-VEGF injections. These include the presence of retinal angiomatous proliferation (RAP), subretinal hemorrhage, subretinal fibrosis, and regression of CNV. This cohort study demonstrates an important observation that collapse of a fibrovascular PED frequently precedes the development of macular atrophy, suggesting that in some instances CNV may help sustain the overlying RPE and photoreceptors.

• Detailed examination of every optical coherence tomography scan of patients with neovascular age-related macular degeneration (NVAMD) from the onset of anti-VEGF treatment throughout the entire course to identify structural changes that preceded atrophy in the exact location where it occurred.

• It is unknown whether VEGF suppression contributes to CNV regression and atrophy; however, it is an important area of investigation. A goal for future treatments is to eliminate leakage and fibrosis from CNV, while promoting its survival to maintain delivery of oxygen and nutrients to overlying RPE and photoreceptors.

INTRODUCTION

Age-related macular degeneration (AMD) is a highly prevalent cause of vision loss which has been extensively studied, but its pathogenesis is poorly understood.[1-2] Key features are drusen, subretinal deposits that can occur in several forms, thickening of Bruch’s membrane, death of retinal pigmented epithelial (RPE) cells and photoreceptors that results in atrophic patches in the macula, and the sporadic development of choroidal neovascularization (CNV).[3] Patients with AMD who lack CNV are classified as having nonneovascular AMD (NNVAMD) and those with CNV are classified as having neovascular AMD (NVAMD). 

AMD usually occurs in patients older than 60 and its incidence increases with further aging. Laboratory animals have a much shorter life span than humans and never develop age-related changes in the eye to the same degree. As a result, they do not spontaneously develop the key features of AMD. While deposits that have some resemblance to drusen can sometimes be induced by genetic or environmental manipulation, a true AMD phenotype has not been observed in animals. The lack of animal models has been a major impediment to elucidation of the pathogenesis of AMD. One compensatory strategy has been to focus on one feature of the AMD phenotype and find ways to mimic it. Rupture of Bruch’s membrane with laser photocoagulation causes CNV[4-5] allowed identification of factors that contribute to CNV including vascular endothelial growth factor (VEGF).[6-7] A second compensatory strategy has been to use various imaging approaches to study changes that occur in the retinas of AMD patients as they develop particular features of the disease. The Age-Related Eye Disease Study (AREDS) followed a large cohort of patients with relatively early stages of AMD to determine if antioxidant vitamins and/or zinc slowed progression to advanced stages of the disease, CNV or geographic atrophy (GA),[8] and found that the risk of GA is increased if eyes have large confluent drusen, pigmentary changes, and/or GA in the fellow eye.[9]

The relationship between CNV and atrophy is complex. The Comparison of Age-related Macular Degeneration Treatments Trial (CATT) and the IVAN study found an association between frequency of anti-VEGF injections and development of macular atrophy[10-12] and the HARBOR study showed a non-statistically significant trend toward greater incident macular atrophy in eyes that received monthly injections versus those that received pro re nata (prn) treatment.[13] Thus, there may be an unexplained association between anti-VEGF injection frequency and the development of macular atrophy, but this is controversial because other studies have concluded otherwise.[14-16] Regardless, it raises the question as to whether mechanisms by which atrophy occurs in eyes with CNV differ from those in eyes that lack CNV. One strategy to investigate this question is to identify eyes of patients with NVAMD who develop macular atrophy during anti-VEGF treatment and study structural features seen with spectral domain-optical coherence tomography (SD-OCT). Baseline characteristics associated with an increased incidence of new macular atrophy during anti-VEGF treatment are retinal angiomatous proliferation (RAP) and foveal intraretinal fluid.[11] Evaluation of SD-OCT scans in eyes that developed macular atrophy at the 2 year endpoint in CATT emphasized that subretinal fibrosis often accompanies atrophy,[17] suggesting that it may be another risk factor. The authors concluded that while examination of SD-OCT scans at one time point provides useful information, longitudinal analyses are needed to identify structural features that occur prior to the development of macular atrophy. A longitudinal analysis was done in 52 eyes of 39 patients with NVAMD treated with anti-VEGF injections who developed atrophy and it was found that atrophy occurred in a location previously occupied by choroidal NV in 72% of eyes.[18] In 31% of the eyes, there was no evidence of any remaining CNV indicating that atrophy was associated with regression of CNV. However, since many of the patients in that study-initiated treatment prior to the availability of SDOCT, serial SD-OCT scans were only available for a portion of their follow up. The resolution provided by SD-OCT is invaluable for evaluating anatomic details in locations that develop atrophy. The present study was designed to study a cohort of NVAMD patients treated with anti-VEGF injections who had serial SD-OCT scans available throughout their entire course, identify a subgroup that developed macular atrophy, and carefully evaluate anatomic changes that occurred in locations that ultimately developed atrophy. 

MATERIALS AND METHODS

This was a retrospective, cohort study conducted at the Wilmer Eye Institute, Johns Hopkins Hospital, Baltimore, MD. The protocol was approved by the Institutional Review Board of the Johns Hopkins Medical Institutions and was conducted in accordance with the Declaration of Helsinki. There were three parts to this study: 1) unbiased selection of a group of NVAMD patients undergoing anti-VEGF treatment, 2) identification of eyes of those patients that developed atrophy during anti-VEGF treatment, and 3) detailed examination of every SD-OCT scan from the onset of treatment throughout the entire course to identify structural changes that preceded atrophy in the exact location where it occurred. To identify a pool of patients with NVAMD to study, we used all patients with NVAMD seen by one of the authors in the 2014 calendar year who had at least one year follow up. The 2014 calendar year was selected because Heidelberg Spectralis SD-OCT (Heidelberg Engineering, Inc., Heidelberg, Germany) had been available for several years prior to ensure that a large cohort of patients could be identified who had SD-OCT scans from the time of onset of CNV through last follow up. For most patients identified because of a visit in 2014, their first visit occurred in a prior year and their last visit was long after 2014. All records and images of these patients from their first visit at the Wilmer Eye Institute to last follow up visit with a cut off of June 2018 were reviewed.

Study Protocol

Serial SD-OCT scans were carefully evaluated by SK and PAC for macular atrophy, intraretinal and subretinal fluid, PEDs, subretinal hyper-reflective material (SRHRM), subretinal fibrosis, and sub- or intraretinal hyper-reflective material. Macular atrophy defined as either complete outer retinal atrophy (cORA) that is a continuous region of EZ loss and severe outer retinal thinning when present with concurrent subretinal fibrosis; or complete RPE and outer retinal atrophy (cRORA) which satisfied the following criteria: 1) a region of hypertransmission of at least 250 μm in diameter, 2) a zone of attenuation or disruption of the RPE of at least 250 μm in diameter, 3) evidence of overlying photoreceptor degeneration, and 4) absence of signs of an RPE tear.[19] Patients who had CNV secondary to causes other than NVAMD, had macular atrophy or subretinal fibrosis at the time of the first visit, had subretinal hemorrhage > 1 disc area during the course of follow-up, or had a diagnosis other than NVAMD causing a decline in visual acuity were excluded.

The change from baseline visual acuity at last follow-up visit was determined. Snellen VA for each patient was evaluated to determine peak VA defined as the best VA that the patient achieved during the follow-up period. Time for each patient to achieve peak VA was also recorded. When a patient had multiple follow-up visits with peak VA, a follow-up visit that was closest in time to the last follow-up visit (last peak VA) was used for analysis. 

RESULTS

Patient demographics and baseline characteristics

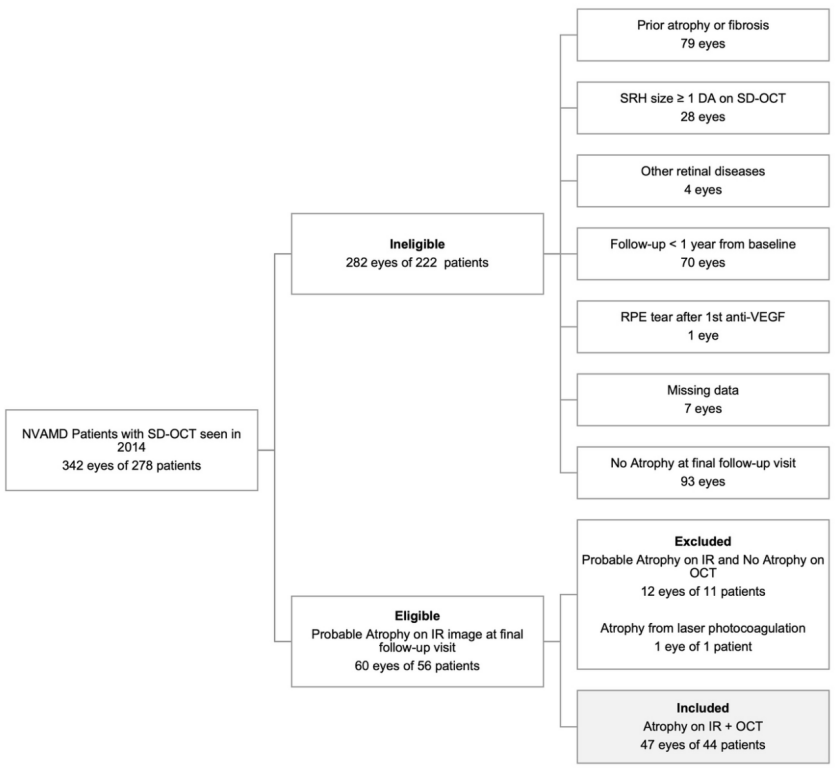
The ascertainment procedure identified 342 eyes of 278 patients with NVAMD treated with anti-VEGF agents (Supplemental Figure 1), of which 47 eyes of 44 patients were included due to development of new macular atrophy. The mean (±SEM) age at initial visit was 80.8 ± 1.0 years, 72.3% of subjects were female, and 100% were white (Supplemental Table 1). Median (IQR) follow-up was 57.5 (47.4 - 73.4) months. Median (IQR) baseline VA converted from Snellen acuity into ETDRS letter score was 65 (60 - 70) letters with 59.6% of subjects ≥ 20/50, 38.3% between 20/63 and 20/160, and 2.1% ≤ 20/200. A substantial percentage of subjects had macular atrophy (40.4%) or subretinal fibrosis (31.9%) in the fellow eye at baseline, and study eyes showed a high prevalence of intraretinal cystoid spaces, subretinal fluid, reticular pseudodrusen, intraretinal RPE migration, and SRHRM (Supplemental Table 1). 

Development of Macular Atrophy

The median time from treatment initiation to development of macular atrophy was 29.6 (IQR, 17.7 - 43.4) months (Table 1). Of the 47 eyes, 7 (14.9%) developed new-onset atrophy by the end of year 1, 12 (25.5%) during year 2, 11 (23.4%) during year 3 and 11 (23.4%) during year 4. The remaining 6 eyes developed atrophy after 4 years of follow-up. 

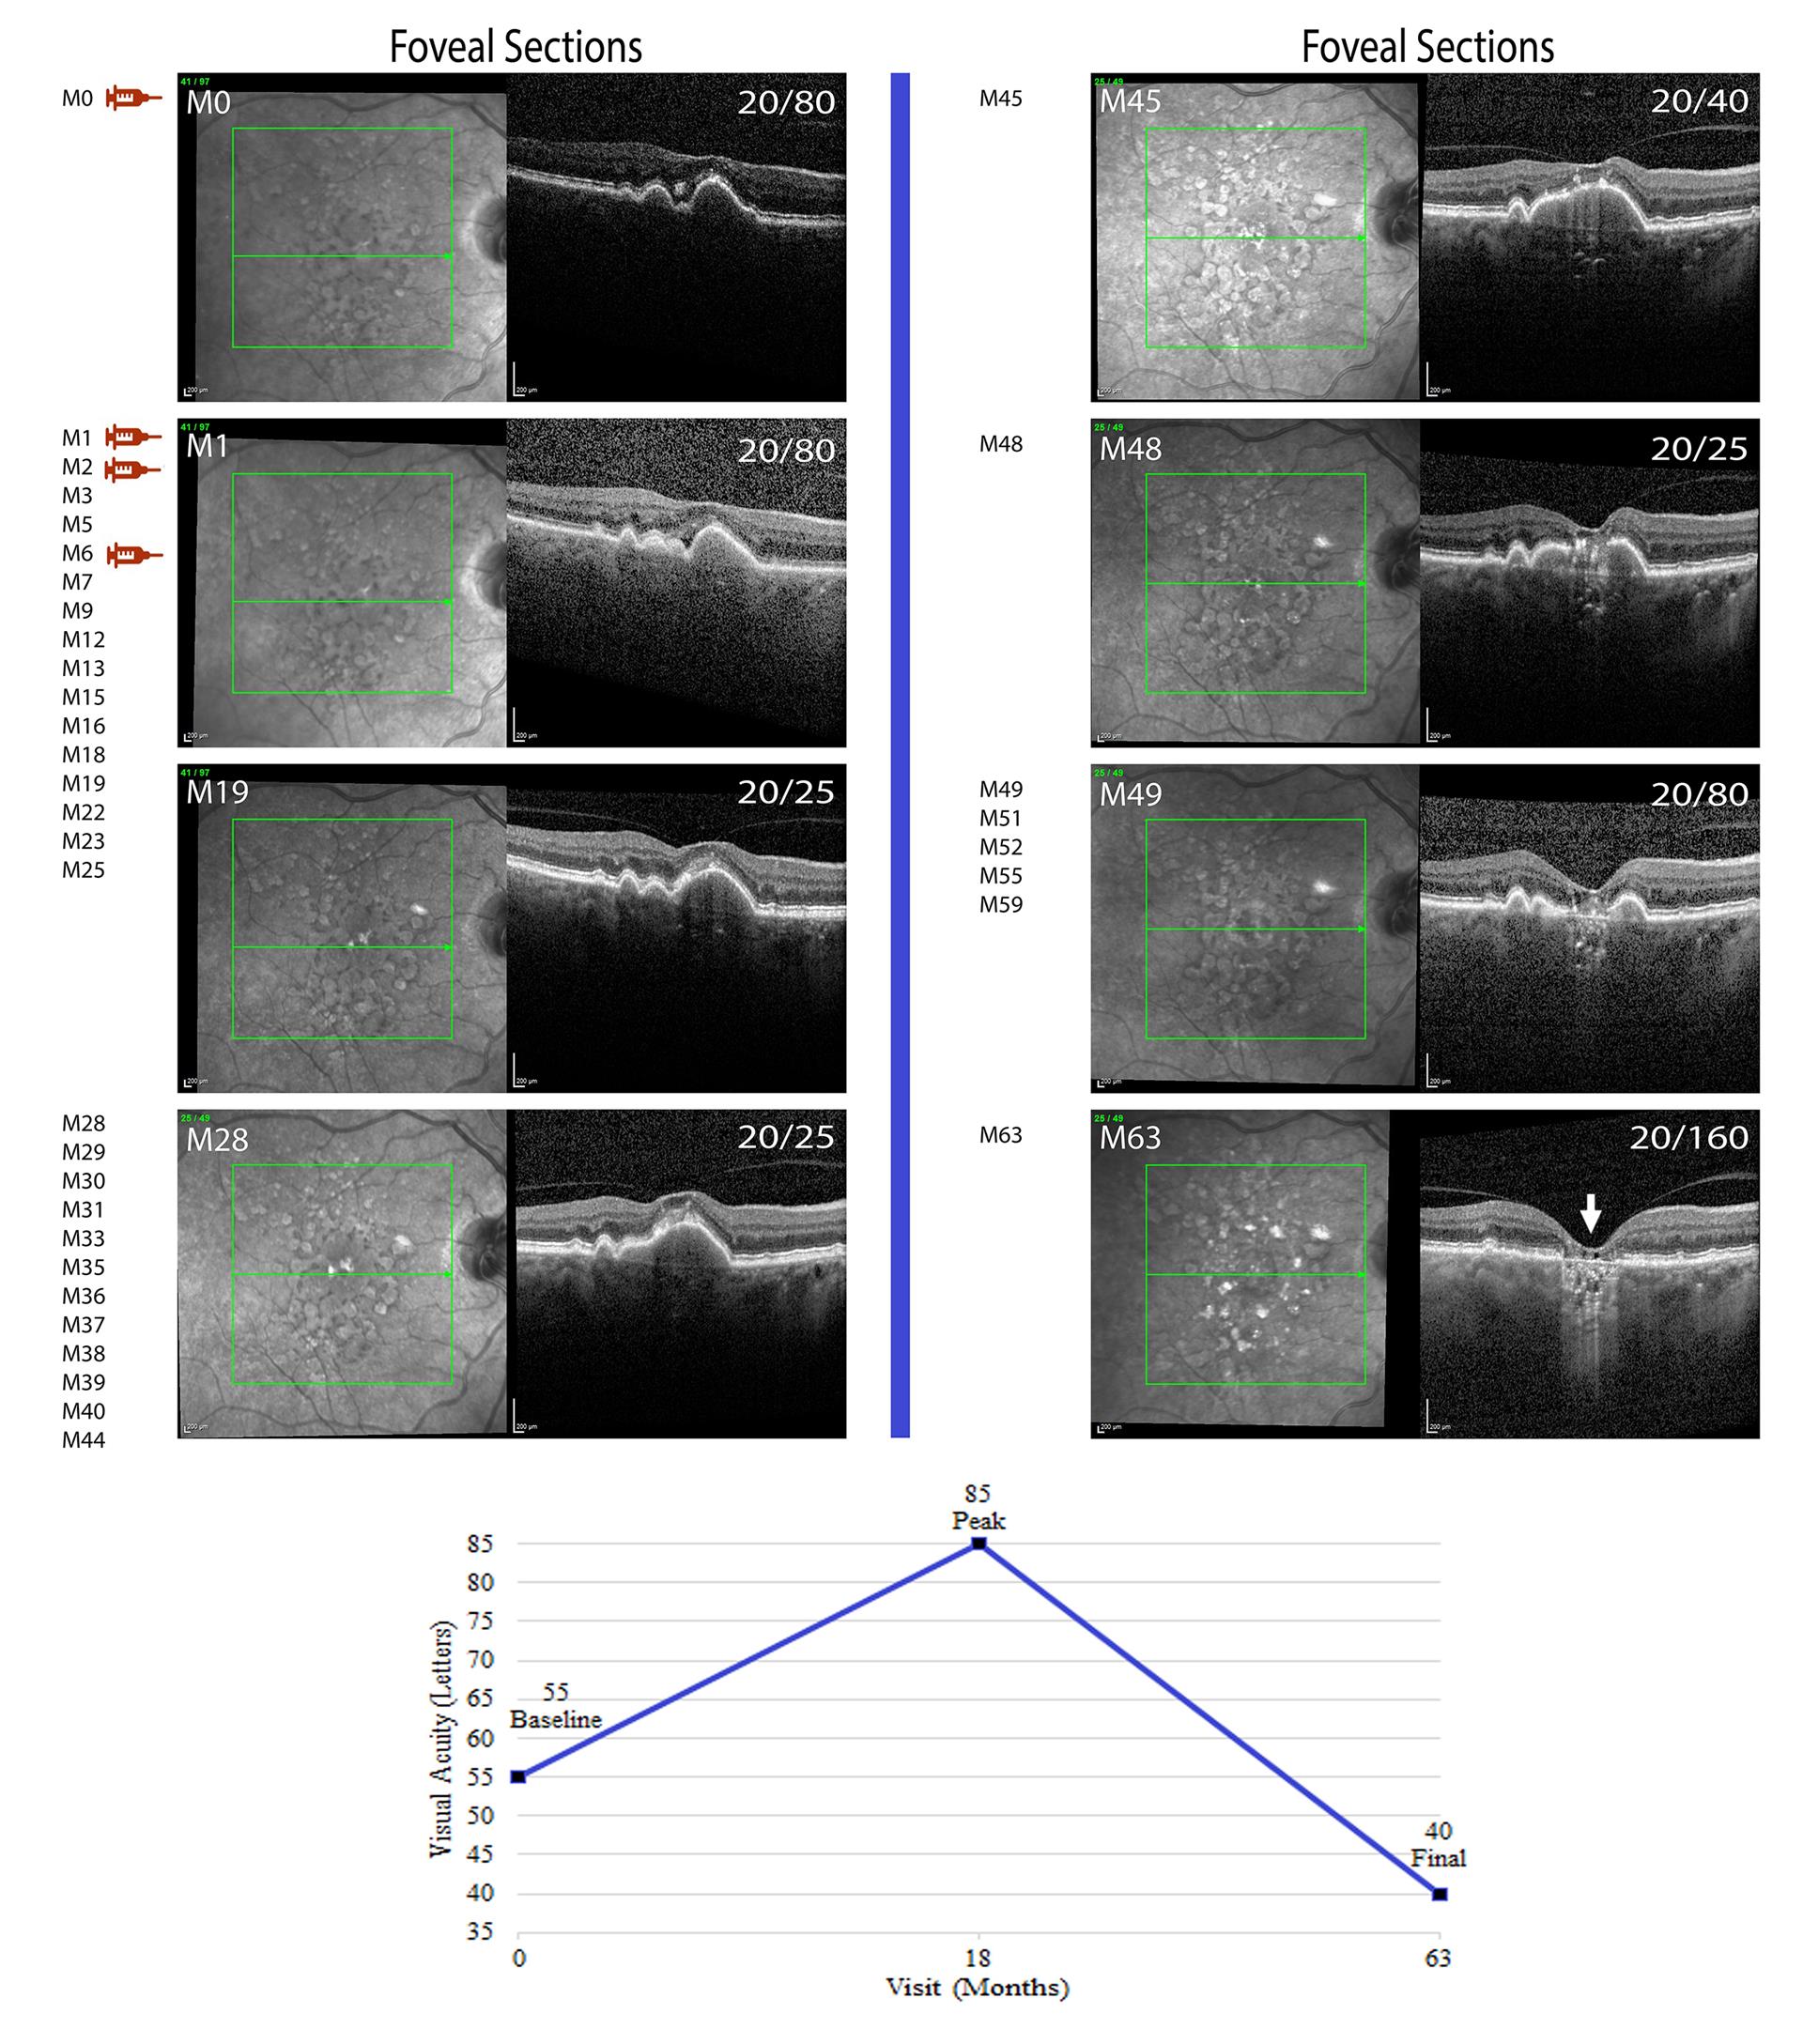
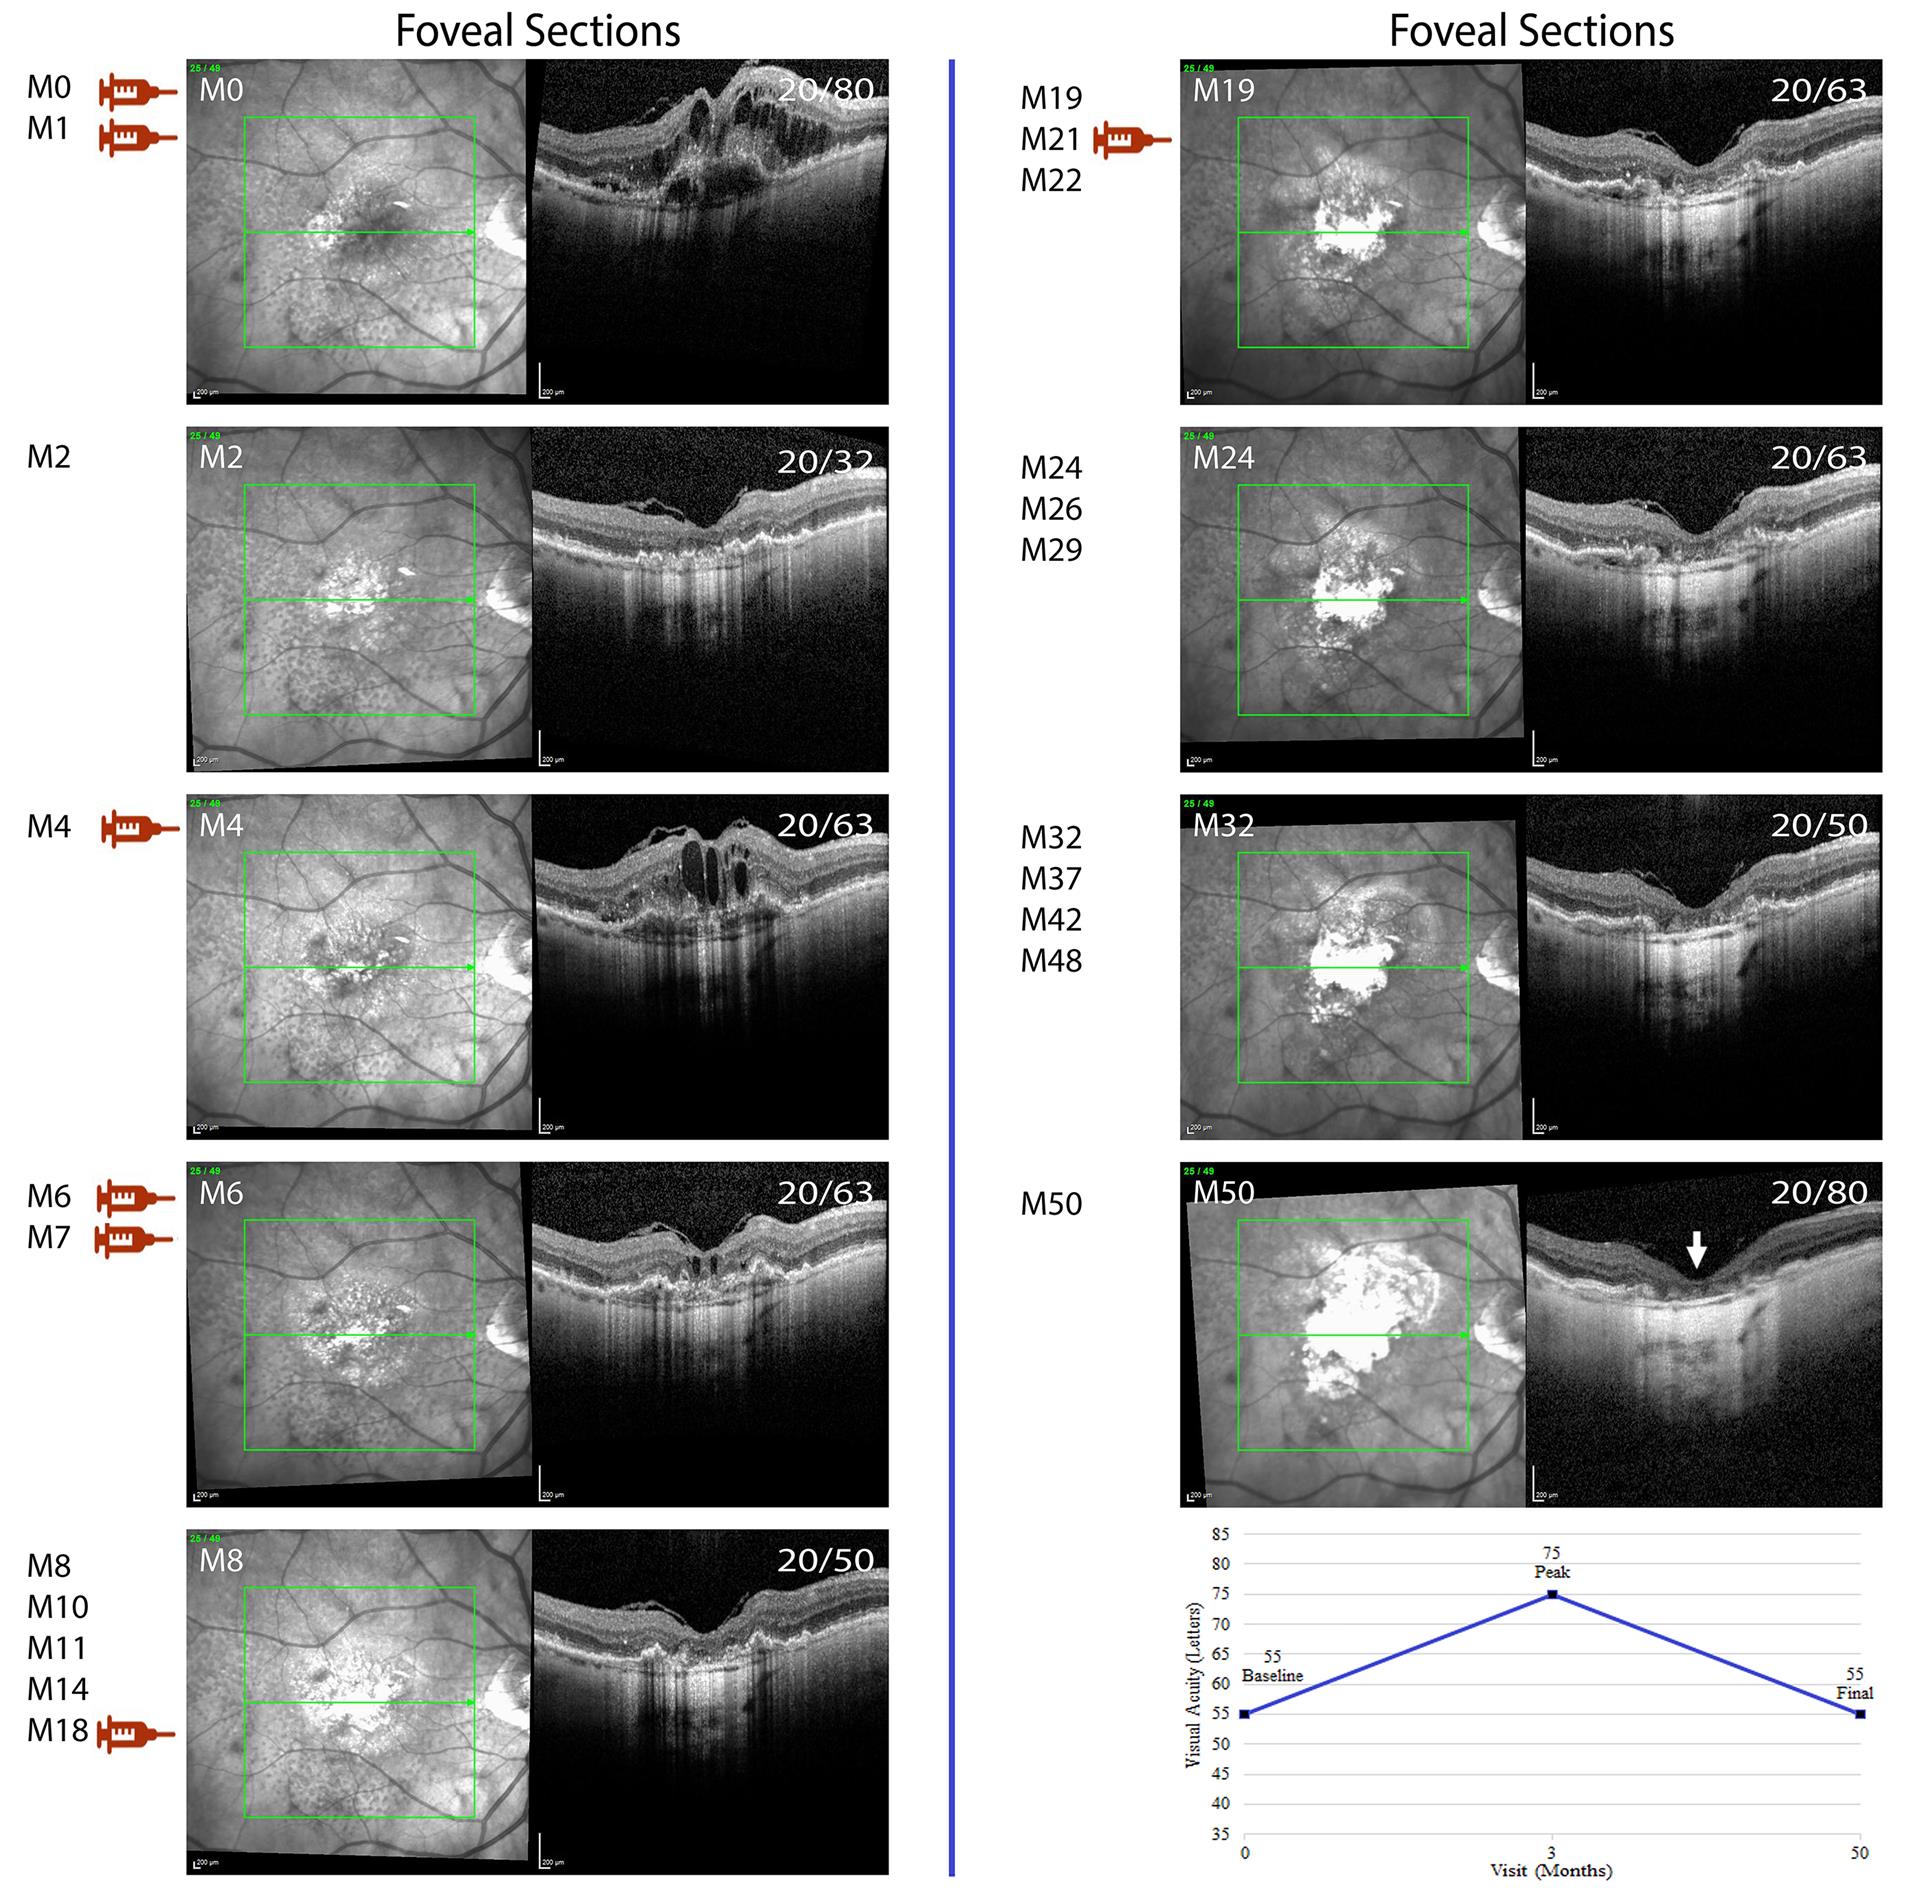
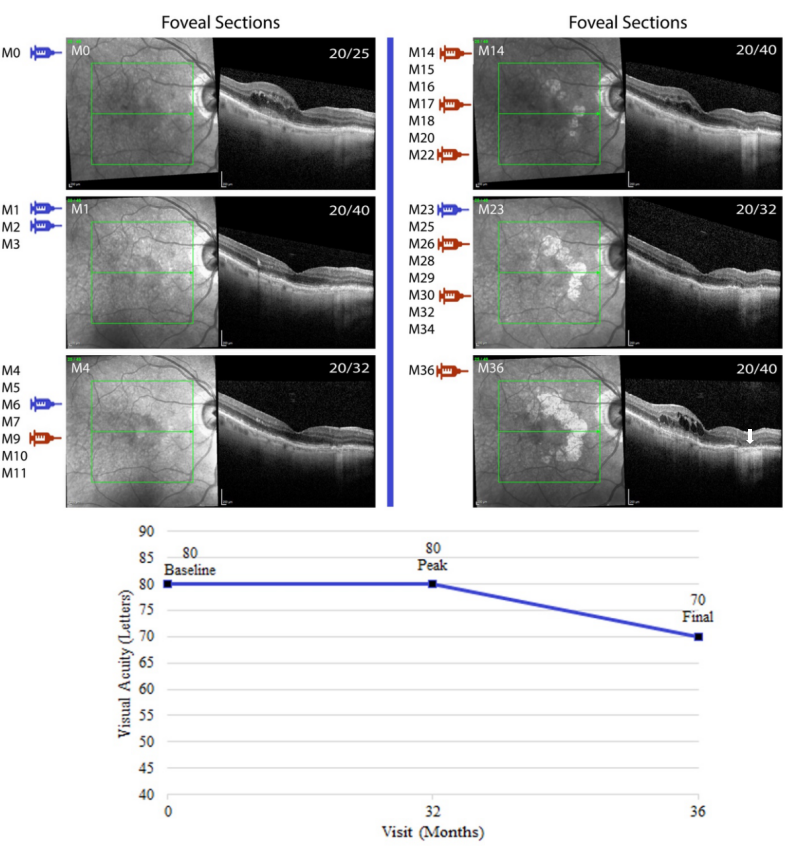
Three situations predisposing to macular atrophy were identified: collapse of a vascularized PED, development of SRHRM and/or subretinal fibrosis, or in association with large drusen and pigmentary changes resulting in an arc of atrophy partially surrounding the fovea in a pattern typically referred to as geographic atrophy (Table 1). Vascularized PEDs with leaking type 1 CNV based upon the presence of overlying subretinal or intraretinal fluid were common in this population of eyes with NVAMD that developed macular atrophy. In 25 eyes, the vascularized PED collapsed during the course of anti-VEGF treatment and after PED collapse, RPE and outer retinal atrophy was observed in that location (Table 1). In 15 of the 25 eyes (60.0%), subretinal and/or intraretinal fluid was reduced and the need for anti-VEGF injections was lessened after PED collapse/atrophy onset, suggesting CNV regression. Figure 1 shows IR images and SD-OCT scans through the fovea of a subject who had collapse of a vascularized PED, onset of atrophy, and reduced vision 43 months after the last anti-VEGF injection. This subject had mild subretinal fluid that resolved after 4 anti-VEGF injections and then maintained good vision without treatment until month (M) 49 when the PED under the fovea collapsed and atrophy became evident. Figure 2 shows images from a subject who had collapse of a vascularized PED and early signs of mild atrophy within 1 month of the first antiVEGF injection. The central atrophy gradually worsened even during a long period without anti-VEGF injections. The patient developed a small PED inferior to the fovea that collapsed by M37 after which there was progressive atrophy in that location as well. Figure 3 shows images of a patient who had collapse of a vascularized PED beneath the fovea after 2 anti-VEGF injections with partial recurrence during 2 months without treatment. During and after treatment with 5 additional anti-VEGF injections, the PED and all intraretinal fluid resolved and there was progressively worsening atrophy involving the fovea with reduction in vision. 

Table 1. Anatomic changes on spectral domain optical coherence tomography in patients with neovascular age-related macular degeneration who developed atrophy


Patients with atrophy

(n=47)

Time to development of atrophy (mos), median (IQR)

29.6 (17.7 - 43.4)

Reason for atrophy, n

  Vascularized PED  Atrophy

  SRHRM/SR fibrosis  Atrophy

  Drusen  Atrophy

a.Reticular pseudodrusen, n/n (%)

b.Typical drusen, n/n (%)


25

15

13

3/13 (23.1)

10/13 (76.9)

Patients who developed atrophy from:

  Single reason

  Multiple reasons

a.Vascularized PED  Atrophy and Drusen  Atrophy, n/n (%)

b.SRHRM/SR fibrosis  Atrophy and Drusen  Atrophy, n/n (%)


41 (87.2)

6 (12.8)

5/6 (83.3)

1/6 (16.7)

Decreased CNV activity after collapse of vascularized PED, n/n (%)

15/25 (60.0)

mos: months; VA: visual acuity; PED: pigment epithelial detachment; NV: neovascular; CNV: choroidal neovascularization; SR: subretinal; HRM: hyperreflective material


Figure 1 Development of macular atrophy following collapse of a vascularized pigment epithelial detachment 43 months after the last anti-VEGF injection. 
Infrared (IR) images and horizontal spectral domain optical coherence tomography (SD-OCT) scans through the fovea from subject 8 who developed subfoveal atrophy from regression of vascularized pigment epithelial detachment. Top left corner shows follow-up visits in months (M) and top right corner shows Snellen visual acuity. Injection symbols (red: aflibercept) show the visits at which anti-VEGF injection was administered. Line graph shows baseline, peak and final visual acuity in letters.
Figure 2 Rapid development of atrophy after collapse of a vascularized pigment epithelial detachment during anti-VEGF treatment.
First and second columns show IR images and horizontal SD-OCT scans through sections 23 and 15 respectively from subject 43. Top left corner shows follow-up visits in months (M) and top right corner shows Snellen visual acuity. Injection symbols (blue: ranibizumab, red:aflibercept) show the visits at which anti-VEGF injection was administered. Line graph shows baseline, peak and final visual acuity in letters.

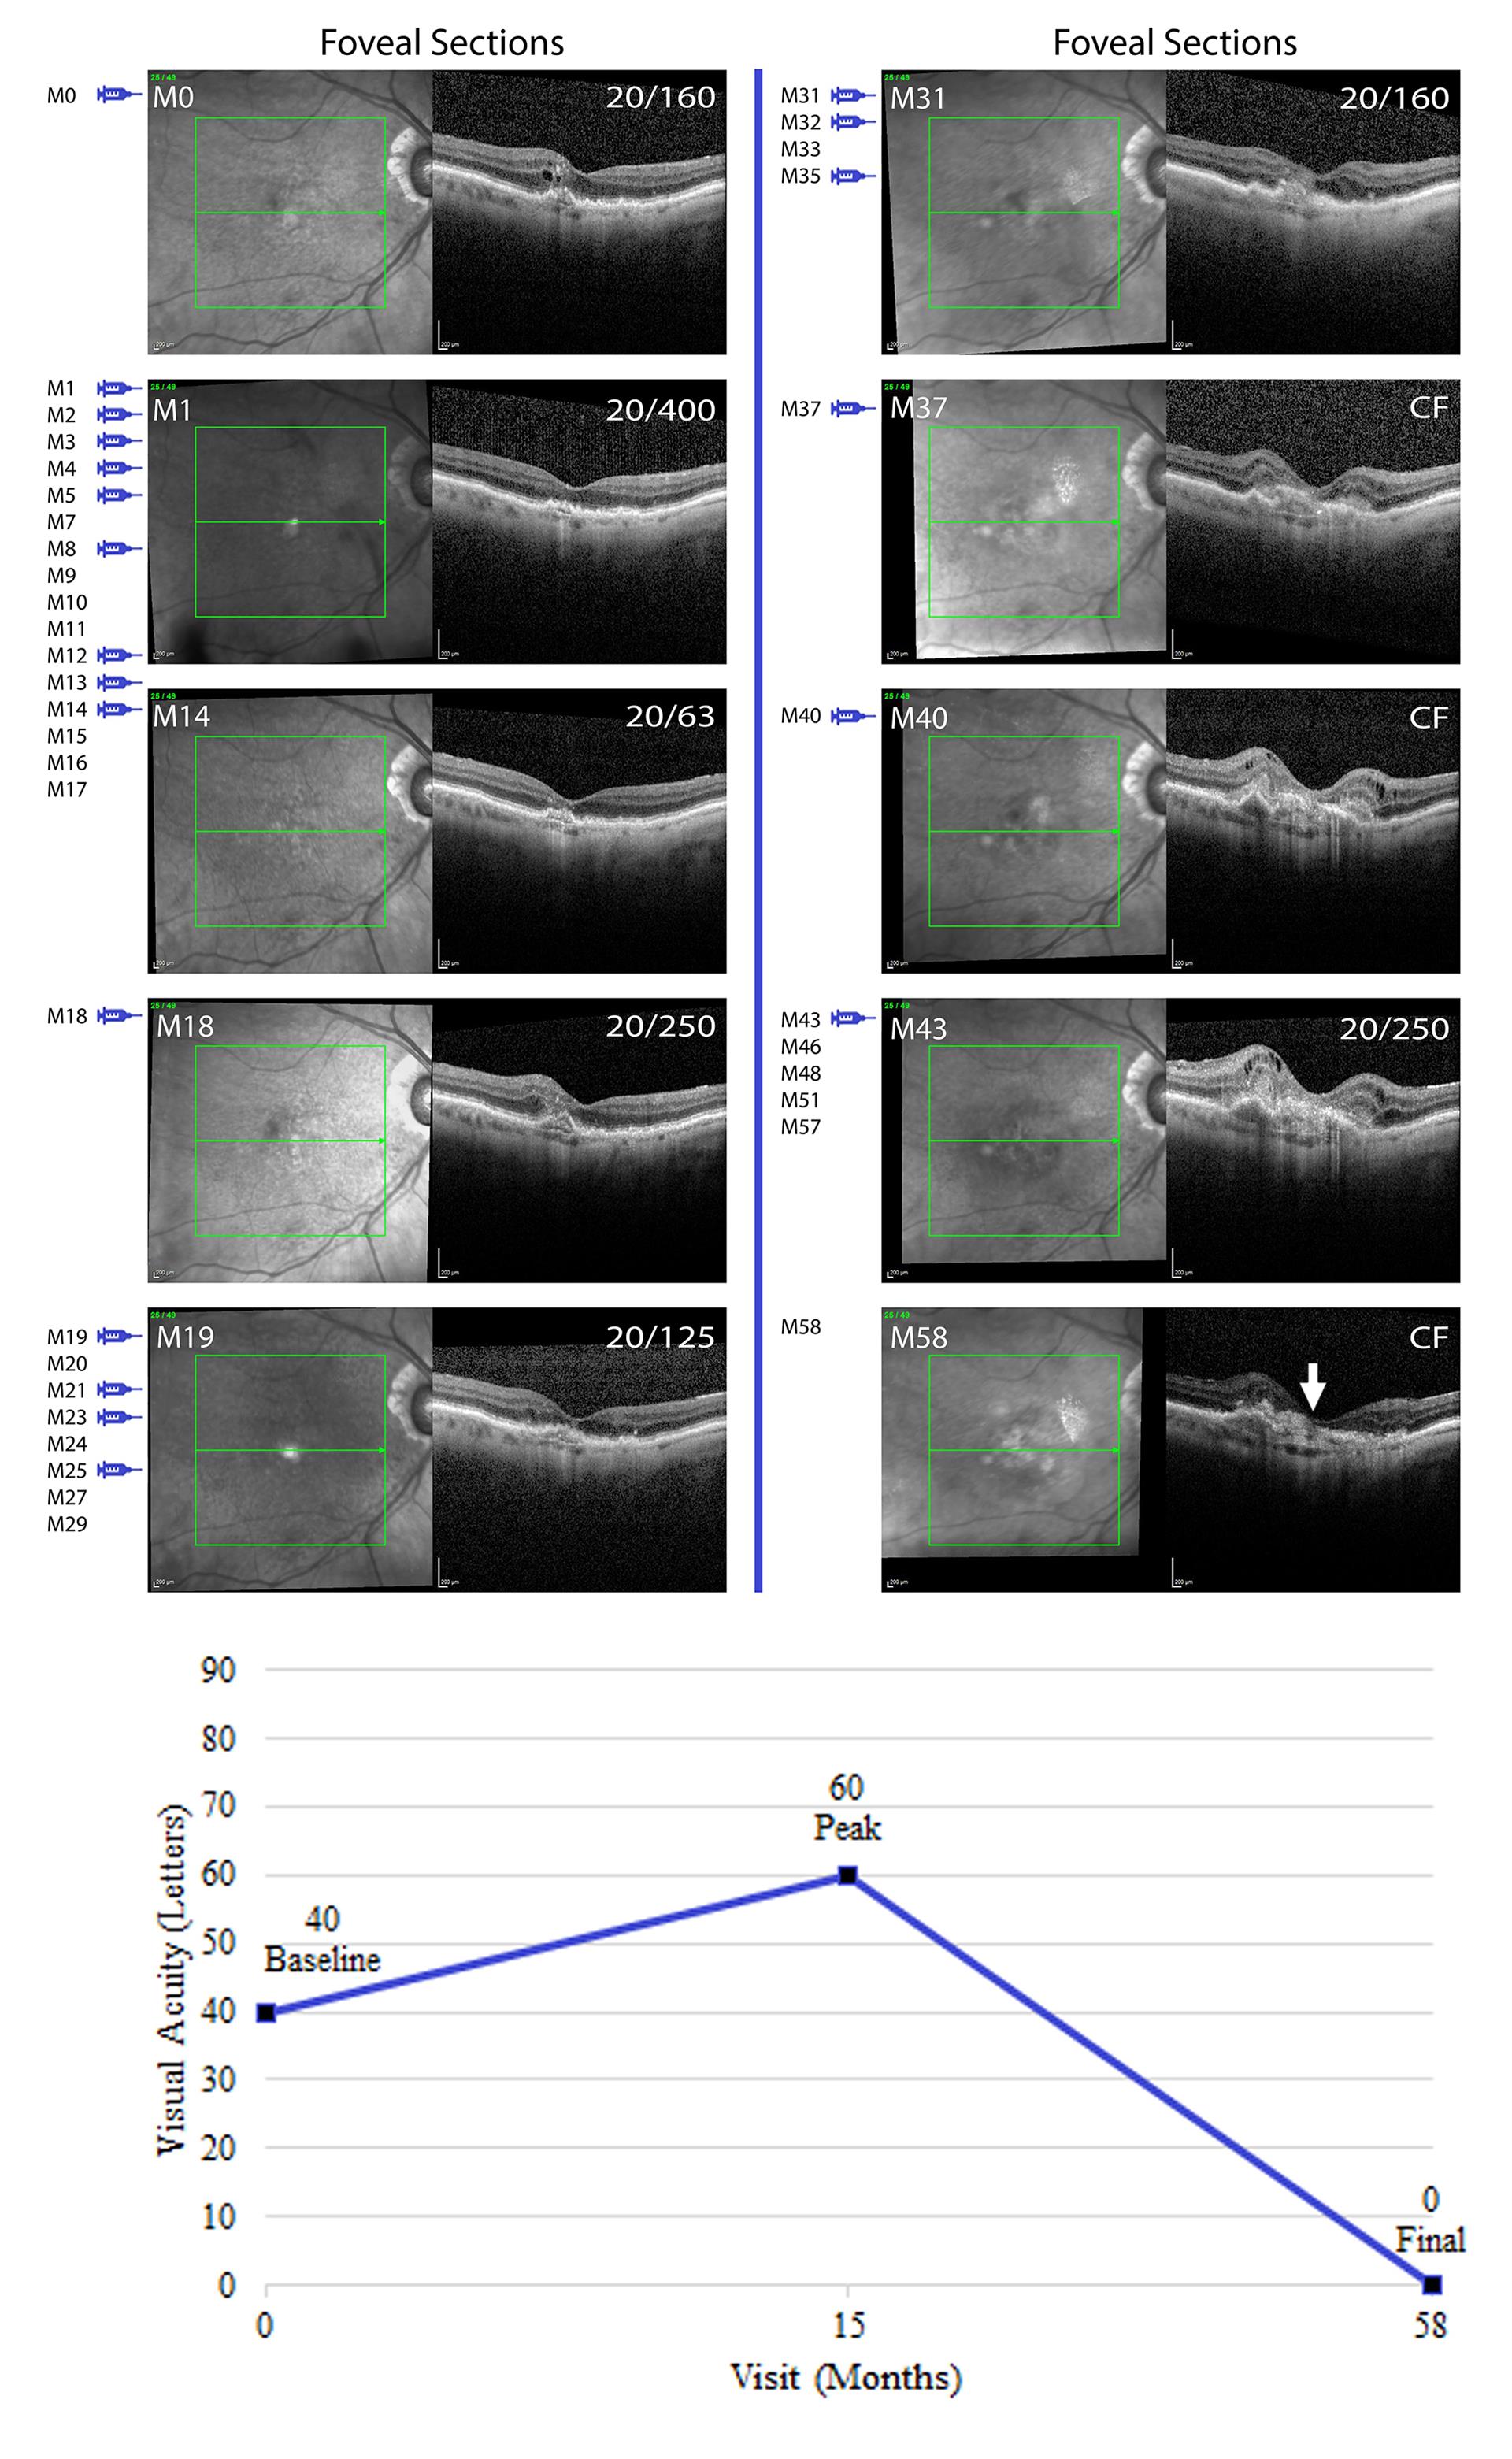
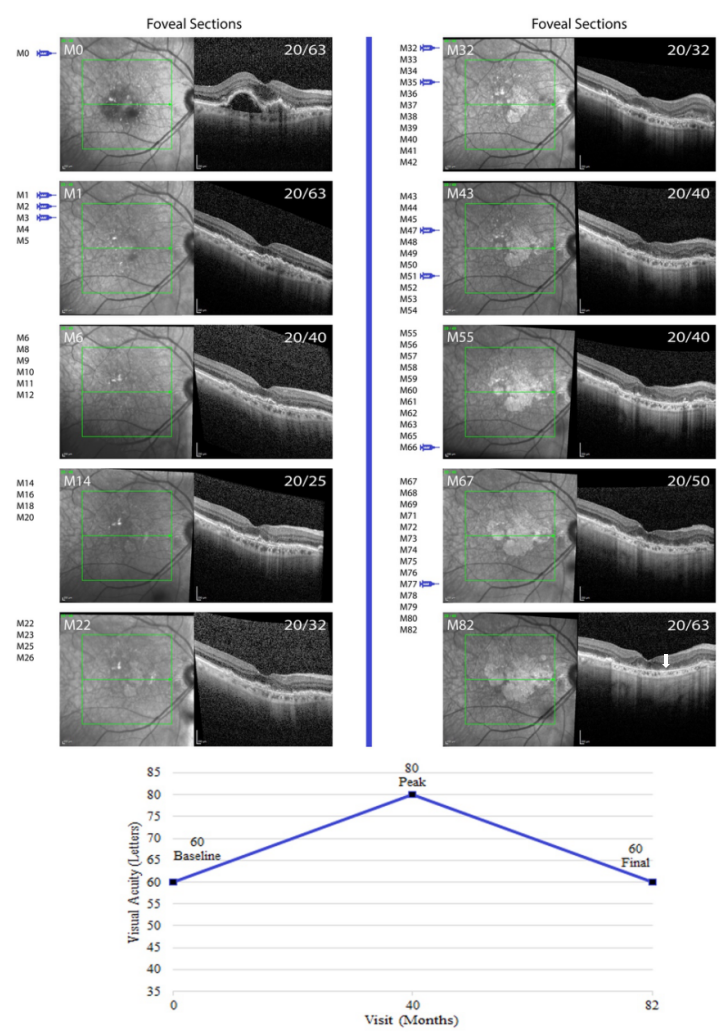
The second anatomic feature found to predispose to macular atrophy was SRHRM and/or subretinal fibrosis. Figure 4 shows images from a subject who had modest improvement in vision during the first year of treatment when monthly injections were given for 6 months followed by reduction in injection frequency. With no treatment between M14 and M18, there was an increase in SRHRM and a decrease in vision. With intermittent treatment over the next 18 months including a 6-month lapse between M25 and M31, there was worsening of SRHRM that evolved into subretinal fibrosis, overlying atrophy, and severe loss of vision.

The third group of anatomic features found to predispose to atrophy was drusen and pigmentary changes. Supplemental Figure 2 shows a subject who had resolution of intraretinal fluid after one anti-VEGF injection and remained stable over the next year with 4 injections. At month 14, atrophy was present nasal to the fovea in a region where only drusen had been previously seen. There were also foci of atrophy superior and inferior to this location that over time coalesced into a semicircle of atrophy surrounding the fovea. This course is consistent with what is commonly referred to as GA occurring in the absence of CNV and since the fovea was not involved, the subject maintained good vision. Supplemental Figure 3 shows a more complex case of a subject with vascularized PEDs on each side of the fovea that collapsed after a single anti-VEGF injection and after 4 injections visual acuity gradually improved with no injections for 23 months and no evidence of leakage. At M14, IR images showed hypopigmented areas inferior and nasal to the fovea corresponding to areas of RPE drop out on SD-OCT scans. These areas of atrophy gradually enlarged and surrounded but only partially involved the fovea so that at last visit, vision was still 20/63. This may be GA, but it is uncertain if the collapse of vascularized PEDs after one anti-VEGF contributed to the development of macular atrophy many months later. There were 6 eyes that developed areas of atrophy from different predisposing factors at different locations (Table 1). 

Figure 3 Macular atrophy after collapse of a vascularized pigment epithelial detachment, partial recurrence, and then resolution. 
IR images and horizontal SD-OCT scans through the fovea from subject 29 who developed subfoveal atrophy in the region of vascularized pigment epithelial detachment collapse. Top left corner shows follow-up visits in months (M) and top right corner shows Snellen visual acuity. Injection symbols (red: aflibercept) show the visits at which anti-VEGF injection was administered. Line graph shows baseline, peak and final visual acuity in letters.

Visual Outcomes

The median VA at last follow up was 55 (IQR, 35 - 70) letters, a median loss of 10 letters (Supplemental Table 2). However, the median peak VA was 75 (IQR, 70 - 80) indicating that on average, subjects gained 10 letters and then subsequently lost 20 letters, a large swing in VA. The median time from baseline to last peak vision was 24 months indicating that most subjects maintained their best vision for about 2 years. Final VA was ≥20/50 in 36.2%, 20/63-20/160 in 34.0%, and ≤20/200 in 29.8%, while peak vision was ≥20/50 in 91.5%, 20/63-20/160 in 8.5%, and ≤20/200 in 0%. Subjects were classified as good visual outcome if final VA was ≥20/50, moderate outcome if VA was 20/63-20/160, and poor outcome if VA was ≤20/200. The pattern of initial gain and subsequent loss of vision occurred across all 3 outcome groups, with the major difference being the amount of loss occurring after initial gain (Supplemental Figure 4). The median number of anti-VEGF injections was 20, but this is not very informative because of the differences in follow-up duration. The injection frequency is more informative; 14.9% received injections every 4-6 weeks, 31.9% received relatively frequent injections (usually between 6 and 12 weeks apart in a treat-and-extend or frequent prn regimen), and 53.2% received prn treatment with relatively long intervals between injections. At last follow-up, atrophy involved the fovea in 44.7% and was felt to contribute to reduced vision, while in 55.3% atrophy was non-fovea involving and did not contribute to reduced vision. In 36.2% of subjects, subretinal fibrosis was present in association with atrophy at last follow-up.
Figure 4 Macular atrophy after development of subretinal fibrosis during infrequent anti-VEGF injections. 
IR images and horizontal SD-OCT scans through the fovea from subject 5 who developed subretinal fibrosis and subsequent severe retinal thinning during a period of infrequent anti-VEGF injections (Category 2). Top left corner shows follow-up visits in months (M) and top right corner shows Snellen visual acuity. Injection symbols (blue: ranibizumab) show the visits at which anti-VEGF injection was administered. Line graph shows baseline, peak and final visual acuity in letters.

DISCUSSION

Macular atrophy can be part of the natural course of AMD. Most attention has been directed to atrophy that occurs in areas of large soft drusen and pigmentary changes, occurring as single or multiple perifoveal spots that gradually enlarge and involve the fovea reducing visual acuity.[9] This type of atrophy has been referred to as GA and its development marks a change from intermediate to advanced AMD which was an outcome measure in AREDS.[8] Atrophy can also occur in eyes of patients with AMD in areas of drusenoid pigment epithelial detachments (PEDs),[20] serous PEDs,[21]subretinal hemorrhage,[22] and subretinal fibrosis.[23] In the AREDS, eyes that developed NVAMD were followed without anti-VEGF treatment because it wasn’t available at that time. During follow-up of 708 evaluable eyes for a mean of 3.2 years, 204 eyes (28.8%) developed macular atrophy.[24] The progression to macular atrophy over time on color fundus photographs was quite linear and was calculated by linear regression to be 6.5% per year. 

Thus, macular atrophy can occur in eyes with NVAMD in the absence of anti-VEGF treatment, but exactly how atrophy evolves in eyes with CNV is unclear. In this study, we found that the most common predisposing event in the location of macular atrophy in patients with NVAMD treated with anti-VEGF injections, was collapse of a vascularized PED indicating regression of type 1 CNV. This adds to the previous demonstration that macular atrophy occurred in areas previously occupied by CNV in another cohort of patients with NVAMD treated with anti-VEGF injections.[18] After the development of atrophy, CNV and associated leakage were no longer detectable suggesting the CNV had regressed. The association of CNV regression with the development of macular atrophy suggests that CNV may have provided oxygen and nutrients to the RPE and outer retina, and after its regression, hypoxia and perturbed metabolism contributed to death of RPE and photoreceptors in that location. Based upon a comparison of histopathology of post-mortem eyes from patients with GA, early AMD, and no AMD, it was hypothesized that GA occurs due to drop out of the choriocapillaris, causing ischemic damage to the macula.[25] Histopathologic studies have also suggested that in some instances CNV may be an adaptive response aimed at overcoming choriocapillaris loss. A recent clinicopathologic correlation demonstrated type 1 CNV without associated exudation in a patient who had good vision despite fluorescein angiographic and OCT evidence of type 1 CNV for 9 years prior to death.[26] The capillary network of new vessels within a shallow RPE detachment centrally appeared similar to eccentric areas of choriocapillaris, which had greater capillary density than the choriocapillaris beneath the new vessels. The authors hypothesized that hypoxia due to choriocapillaris loss beneath the macula stimulated growth of type 1 CNV, which compensated and sustained the structure and function of the macula. This hypothesis is also supported by mapping of type 1 CNV in eyes with GA showing reduced progression of atrophy in areas overlying type 1 CNV.[27]

Other changes that predisposed to macular atrophy were development of SRHRM and/or subretinal fibrosis, and large drusen and pigmentary changes with slow development of atrophy in a pattern consistent with GA. This is consistent with changes seen in an evaluation of SD-OCT scans at year 2 in 68 eyes from the CATT study.[17] It is likely that the mechanism of atrophy development is different in these subjects from those with collapse of a vascularized PED. 

A weakness of this study is the retrospective collection of data from patients treated as part of the standard care without a standardized protocol for treatment. However, it is valuable to assess anatomic features that precede atrophy in clinical practice, because this provides real-world data that supplements data from clinical trials. Detailed analyses of serial SD-OCT images obtained during clinical trials involving NVAMD patients treated with anti-VEGF agents have not been reported, and therefore the current study helps to fill a void in the literature and may help to stimulate such studies in the future. The lack of best-corrected visual acuity measurements is a weakness and should be considered when interpreting the visual outcomes, but the major findings of this study are not related to visual outcomes, but rather are based upon serial SD-OCT images that are well-documented in the figures which is a strength. 

The demonstration that macular atrophy is frequently preceded by collapse of a fibrovascular PED is an important observation that supports other emerging data suggesting that CNV may in some instances provide benefits that help to sustain the overlying RPE and photoreceptors. These benefits are usually masked by the negative impact of exudation and its complications but can be inferred by the occurrence of macular atrophy in locations of CNV regression. Whether VEGF suppression contributes to CNV regression and atrophy is an unanswered question, but it is an important area of investigation for the future, because if found to be the case, it would motivate studies aimed at promoting survival and maturation of CNV to promote supply of oxygen and nutrients while eliminating exudation. 

Correction notice

None

Acknowledgement

None

Author Contributions

(Ⅰ) Conception and design: SK and PAC
(Ⅱ) Administrative support: SK, RC, AWS, JTH, AS, ASW, IZG, SDS, PG, MMS, BSS, AA, OA, MI and PAC
(Ⅲ) Provision of study materials or patients: RC, AWS, JTH, AS, ASW, IZG, SDS, PG, MMS and PAC
(Ⅳ) Collection and assembly of data: SK, BSS, AA, OA and MI
(Ⅴ) Data analysis and interpretation: SK, AA and PAC
(Ⅵ) Manuscript writing: All authors
(Ⅶ) Final approval of manuscript: All authors

Funding

The study was supported by an unrestricted grant from Research to Prevent Blindness, New York, NY.

Conflict of Interests

PAC reports grants and personal fees from AERPIO Pharmaceuticals, personal fees from Allegro, personal fees from Applied Genetic Technologies Corporation, personal fees from Asclepix Therapeutics, personal fees from Baucsh and Lomb, personal fees from Curevac, personal fees from Exonate Ltd. grants and personal fees from Genentech/Roche Inc. grants and personal fees from Sanofi Genzyme, grants and personal fees from Graybug Vision, personal fees from Merck & Co, Inc. personal fees from NOVARTIS Pharmaceuticals Corporation, grants and personal fees from Oxford Biomedica, grants and personal fees from Regeneron Pharmaceuticals, Inc. grants and personal fees from Regenxbio, Inc. personal fees from Wave Life Sciences, outside the submitted work. AWS reports being on scientific advisory boards for Novartis and Allergan, Inc during the conduct of the study and outside the submitted work.

JTH reprots grants and other from Bayer Pharmaceuticals, Cirrus Pharmaceuticals, Character Biosciences, Inc., and Seeing Medicines, Inc. during the conduct of the study and outside the submitted work.

SK, RC, AS, ASW, IZG, SDS, PG, MMS, BSS, AA, OA, and MI have nothing to disclose.

Patient consent for publication

None

Ethical Statement

None

Provenance and Peer Review

This article was a standard submission to our journal. The article has undergone peer review with our anonymous review system.

Data Sharing Statement

None

Open Access Statement

This is an Open Access article distributed in accordance with the Creative Commons Attribution-NonCommercial-NoDerivs 4.0 International License (CC BY-NC-ND 4.0), which permits the non-commercial replication and distribution of the article with the strict proviso that no changes or edits are made and the original work is properly cited (including links to both the formal publication through the relevant DOI and the license).

SUPPLEMENTAL MATERIAL METHODS

Definitions

Intraretinal RPE migration was defined as small discrete hyperreflective and highly backscattering lesions within the neurosensory retina.20 Reticular pseudodrusen were defined as collections of granular hyperreflective material above the RPE, in the subretinal space located primarily between the RPE and the ellipsoid zone (EZ).21 Subretinal hyperreflective material (SRHRM) was defined as hyperreflective material in the subretinal space above the RPE. When SRHRM was highly reflective with well-demarcated, sharp borders and loss or disruption of EZ and external limiting membrane (ELM), it was designated as subretinal fibrosis.22, 23 Recurrence of CNV activity on SD-OCT was defined as the presence of intraretinal or subretinal fluid or an increase in PED size compared to prior visit. 

Statistical analysis

All statistical tests were performed using Stata® software version 15.1 (StataCorp, College Station, TX, USA). Descriptive statistics were calculated for continuous and categorical variables. For categorical variables, frequency and percentage were summarized. For continuous variables, summary statistics were provided using mean and standard error of mean (SEM) or median and interquartile range (IQR).
Supplemental Figure 1 Flow diagram of patients with neovascular age-related macular degeneration analyzed in the study.
NVAMD: neovascular age-related macular degeneration; VEGF: vascular endothelial growth factor; SRH: subretinal hemorrhage; DA: disc area; SD-OCT: spectral domain optical coherence tomography; IR: infrared.
Supplemental Figure 2 Development of macular atrophy with features and course typical of geographic atrophy.
Infrared (IR) images and horizontal spectral domain optical coherence tomography (SD-OCT) scans through the fovea from subject 41 who developed non-fovea involving atrophy from prior reticular pseudodrusen. Top left corner shows follow-up visits in months (M) and top right corner shows Snellen visual acuity. Injection symbols (blue: ranibizumab, red: aflibercept) show the visits at which anti-VEGF injection was administered. Line graph shows baseline, peak and final visual acuity in letters.
Supplemental Figure 3 Collapse of fibrovascular pigment epithelial detachments after a single anti-VEGF injection followed by macular atrophy many months later in a pattern consistent with typical geographic atrophy.
IR images and horizontal SD-OCT scans through the fovea from subject 4 who had pigment epithelial detachments that collapsed after a single anti-VEGF injection. At month 14, hypopigmented areas nasally and inferior to the fovea were observed and showed progressive dropout of RPE and photoreceptors on subsequent scans. The area of atrophy gradually expanded and surrounded the fovea in a pattern typical of geographic atrophy, but it is uncertain whether the prior PED collapse played any role. Top left corner shows follow-up visits in months (M) and top right corner shows Snellen visual acuity. Injection symbols (blue: ranibizumab) show the visits at which anti-VEGF injection was administered. Line graph shows baseline, peak and final visual acuity in letters.

Supplemental Figure 4 Visual outcomes in patients with neovascular age-related macular degeneration treated with intravitreous injections of a vascular endothelial growth factor neutralizing protein who developed atrophy.
(A) Line graphs show baseline, peak and final visual acuity for 17 patients who had a good final visual outcome (visual acuity ≥ 20/50). 
(B) Line graphs show baseline, peak and final visual acuity for 16 patients who had a moderate final visual outcome (visual acuity between 20/63 and 20/160). 
(C) Line graphs show baseline, peak and final visual acuity for 14 patients who had a poor final visual outcome (visual acuity ≤ 20/200).

Supplemental Table 1 Baseline demographic and anatomic characteristics at time of neovascular age-related macular degeneration diagnosis in patients who developed atrophy


Patients with atrophy

(n=47)

Baseline Demographic Characteristics

Age (yrs), mean±SEM

80.8±1.0

Females, n (%)

34 (72.3)

Race, n (%)

  White


47 (100)

Follow-up duration (mos), median (IQR)

57.5 (47.4 - 73.4)

Baseline VA (Snellen), n (%)

  20/50 or better

  20/63 - 20/160

  20/200 or worse


28 (59.6)

18 (38.3)

1 (2.1)

Baseline Anatomic Characteristics

Fellow Eye, n (%)

  Atrophy

  SR Fibrosis


19 (40.4)

15 (31.9)

Study Eye, n (%)

  Intraretinal cysts

  Subretinal fluid

  Reticular pseudodrusen

  Intraretinal pigment migration

  SRHRM


38 (80.9)

32 (68.1)

21 (44.7)

35 (74.5)

24 (51.1)

VA: visual acuity; SEM: standard error of mean; mos: months; IQR: interquartile range; SR: subretinal; SRHRM: subretinal hyperreflective material


Supplemental Table 2. Functional outcomes in neovascular age-related macular degeneration patients who developed atrophy 


Patients with atrophy

(n=47)

Follow-up duration (mos), median (IQR)

57.5 (47.4 - 73.4)

Baseline VA (letters), median (IQR)

65 (60 - 70)

Baseline VA, n (%)

  20/50 or better

  20/63 - 20/160

  20/200 or worse


28 (59.6)

18 (38.3)

1 (2.1)

Final VA (letters), median (IQR)

55 (35 - 70)

Final VA, n (%)

  20/50 or better

  20/63 - 20/160

  20/200 or worse


17 (36.2)

16 (34.0)

14 (29.8)

Change in VA, n (%)

  Gain of ≥3 lines

  Change of <3 lines

  Loss of ≥3 lines


4 (8.5)

21 (44.7)

22 (46.8)

Peak VA (letters), median (IQR)

75 (70 - 80)

Peak VA, n (%)

  20/50 or better

  20/63 - 20/160

  20/200 or worse


43 (91.5)

4 (8.5)

0 (0)

Change in VA among patients with foveal atrophy, n/n (%)

      Gain of ≥3 lines

      Change of <3 lines

      Loss of ≥3 lines


Change in VA among patients with non-foveal atrophy, n/n (%)

      Gain of ≥3 lines

      Change of <3 lines

      Loss of ≥3 lines

n=21 (44.7%)

1/21 (4.8)*

7/21 (33.3)

13/21 (61.9)


n=26 (55.3%)

3/26 (11.5)

14/26 (53.9)

9/26 (34.6)**

Recent follow-up visit with peak VA (mos), median (IQR)

24 (14 - 39)

Total number of recurrences, median (IQR)

15 (8 - 26)

Number of Anti-VEGF injections, median (IQR)


20 (10 - 29)

Frequency of Anti-VEGF injections, n (%)

  Every 4-6 weeks

  Every >6-12 weeks***

  PRN with long intervals without treatment


7 (14.9)

15 (31.9)

25 (53.2)

Continuous variables are described as median (IQR).

VA: visual acuity; SEM: standard error of mean; mos: months; PRN: pro re nata

*Patient who gained 3 lines of visual acuity after undergoing cataract surgery.

**Five of the nine patients with non-foveal atrophy who had loss of VA had subfoveal fibrosis, rest of the four patients had loss of VA from visually significant cataract, persistent intraretinal cystoid spaces involving the fovea despite treatment with anti-VEGF injections, combination of persistent intraretinal cystoid spaces involving the parafoveal region despite treatment with anti-VEGF injections and corneal edema from anterior basement membrane dystrophy, and subretinal hemorrhage involving the fovea.

1、Friedman%20DS%2C%20O%E2%80%99Colmain%20BJ%2C%20Mu%C3%B1oz%20B%2C%20et%20al.%20Prevalence%20%0Aof%20age-related%20macular%20degeneration%20in%20the%20United%20States.%20%0AArch%20Ophthalmol.%202004%2C%20122(4)%3A%20564-572.%20DOI%3A%2010.1001%2F%0Aarchopht.122.4.564.Friedman%20DS%2C%20O%E2%80%99Colmain%20BJ%2C%20Mu%C3%B1oz%20B%2C%20et%20al.%20Prevalence%20%0Aof%20age-related%20macular%20degeneration%20in%20the%20United%20States.%20%0AArch%20Ophthalmol.%202004%2C%20122(4)%3A%20564-572.%20DOI%3A%2010.1001%2F%0Aarchopht.122.4.564.
2、Klein R, Klein BE, Knudtson MD, et al. Prevalence of age-related macular degeneration in 4 racial/ethnic groups in the multi-ethnic study of atherosclerosis. Ophthalmology. 2006, 113(3): 373-380. DOI: 10.1016/ j.ophtha.2005.12.013.Klein R, Klein BE, Knudtson MD, et al. Prevalence of age-related macular degeneration in 4 racial/ethnic groups in the multi-ethnic study of atherosclerosis. Ophthalmology. 2006, 113(3): 373-380. DOI: 10.1016/ j.ophtha.2005.12.013.
3、Green WR, Enger C. Age-related macular degeneration histopathologic studies: the 1992 Lorenz E. Zimmerman Lecture. 1992. Retina. 2005, 25(5 Suppl): 1519-1535. DOI: 10.1097/00006982-200507001-00015.Green WR, Enger C. Age-related macular degeneration histopathologic studies: the 1992 Lorenz E. Zimmerman Lecture. 1992. Retina. 2005, 25(5 Suppl): 1519-1535. DOI: 10.1097/00006982-200507001-00015.
4、Ryan SJ. Subretinal neovascularization.Natural history of an experimental model. Arch Ophthalmol. 1982, 100(11): 1804-1809. DOI: 10.1001/ archopht.1982.01030040784015.Ryan SJ. Subretinal neovascularization.Natural history of an experimental model. Arch Ophthalmol. 1982, 100(11): 1804-1809. DOI: 10.1001/ archopht.1982.01030040784015.
5、Tobe T, Ortega S, Luna JD, et al. Targeted disruption of the FGF2 gene does not prevent choroidal neovascularization in a murine model. Am J Pathol. 1998, 153(5): 1641-1646. DOI: 10.1016/S0002-9440(10)65753-7.Tobe T, Ortega S, Luna JD, et al. Targeted disruption of the FGF2 gene does not prevent choroidal neovascularization in a murine model. Am J Pathol. 1998, 153(5): 1641-1646. DOI: 10.1016/S0002-9440(10)65753-7.
6、Kwak N, Okamoto N, Wood JM, et al. VEGF is major stimulator in model of choroidal neovascularization. Investig Ophthalmol Vis Sci. 2000, 41(10): 3158-3164.Kwak N, Okamoto N, Wood JM, et al. VEGF is major stimulator in model of choroidal neovascularization. Investig Ophthalmol Vis Sci. 2000, 41(10): 3158-3164.
7、Saishin Y, Saishin Y, Takahashi K, et al. VEGFTRAP(R1R2) suppresses choroidal neovascularization and VEGF-induced breakdown of the blood-retinal barrier. J Cell Physiol. 2003, 195(2): 241-248. DOI: 10.1002/ jcp.10246.Saishin Y, Saishin Y, Takahashi K, et al. VEGFTRAP(R1R2) suppresses choroidal neovascularization and VEGF-induced breakdown of the blood-retinal barrier. J Cell Physiol. 2003, 195(2): 241-248. DOI: 10.1002/ jcp.10246.
8、Age-Related Eye Disease Study Research Group. A randomized, placebo-controlled, clinical trial of high-dose supplementation with vitamins C and E, beta carotene, and zinc for age-related macular degeneration and vision loss: AREDS report no. 8. Arch Ophthalmol. 2001, 119(10): 1417-1436. DOI: 10.1001/archopht.119.10.1417.Age-Related Eye Disease Study Research Group. A randomized, placebo-controlled, clinical trial of high-dose supplementation with vitamins C and E, beta carotene, and zinc for age-related macular degeneration and vision loss: AREDS report no. 8. Arch Ophthalmol. 2001, 119(10): 1417-1436. DOI: 10.1001/archopht.119.10.1417.
9、Klein ML, Ferris FL 3rd, Armstrong J, et al. Retinal precursors and the development of geographic atrophy in age-related macular degeneration. Ophthalmology. 2008, 115(6): 1026-1031. DOI: 10.1016/j.ophtha.2007.08.030.Klein ML, Ferris FL 3rd, Armstrong J, et al. Retinal precursors and the development of geographic atrophy in age-related macular degeneration. Ophthalmology. 2008, 115(6): 1026-1031. DOI: 10.1016/j.ophtha.2007.08.030.
10、Comparison of Age-related Macular Degeneration Treatments Trials Research Group, Martin DF, Maguire MG, et al. Ranibizumab and bevacizumab for treatment of neovascular age-related macular degeneration: two-year results. Ophthalmology. 2012, 119(7): 1388-1398. DOI: 10.1016/j.ophtha.2012.03.053.Comparison of Age-related Macular Degeneration Treatments Trials Research Group, Martin DF, Maguire MG, et al. Ranibizumab and bevacizumab for treatment of neovascular age-related macular degeneration: two-year results. Ophthalmology. 2012, 119(7): 1388-1398. DOI: 10.1016/j.ophtha.2012.03.053.
11、Grunwald JE, Daniel E, Huang J, et al. Risk of geographic atrophy in the comparison of age-related macular degeneration treatments trials. Ophthalmology. 2014, 121(1): 150-161. DOI: 10.1016/j.ophtha.2013.08.015.Grunwald JE, Daniel E, Huang J, et al. Risk of geographic atrophy in the comparison of age-related macular degeneration treatments trials. Ophthalmology. 2014, 121(1): 150-161. DOI: 10.1016/j.ophtha.2013.08.015.
12、Chakravarthy U, Harding SP, Rogers CA, et al. Alternative treatments to inhibit VEGF in age-related choroidal neovascularisation: 2-year findings of the IVAN randomised controlled trial. Lancet. 2013, 382(9900): 1258-1267. DOI: 10.1016/S0140-6736(13)61501-9.Chakravarthy U, Harding SP, Rogers CA, et al. Alternative treatments to inhibit VEGF in age-related choroidal neovascularisation: 2-year findings of the IVAN randomised controlled trial. Lancet. 2013, 382(9900): 1258-1267. DOI: 10.1016/S0140-6736(13)61501-9.
13、Sadda SR, Tuomi LL, Ding B, et al. Macular atrophy in the HARBOR study for neovascular age-related macular degeneration. Ophthalmology. 2018, 125(6): 878-886. DOI: 10.1016/j.ophtha.2017.12.026.Sadda SR, Tuomi LL, Ding B, et al. Macular atrophy in the HARBOR study for neovascular age-related macular degeneration. Ophthalmology. 2018, 125(6): 878-886. DOI: 10.1016/j.ophtha.2017.12.026.
14、Li A, Rieveschl NB, Conti FF, et al. Long-term assessment of macular atrophy in patients with age-related macular degeneration receiving anti-vascular endothelial growth factor. Ophthalmol Retina. 2018, 2(6): 550-557. DOI: 10.1016/j.oret.2017.10.010.Li A, Rieveschl NB, Conti FF, et al. Long-term assessment of macular atrophy in patients with age-related macular degeneration receiving anti-vascular endothelial growth factor. Ophthalmol Retina. 2018, 2(6): 550-557. DOI: 10.1016/j.oret.2017.10.010.
15、Bailey C, Scott LJ, Rogers CA, et al. Intralesional macular atrophy in anti-vascular endothelial growth factor therapy for age-related macular degeneration in the IVAN trial. Ophthalmology.2019, 126(1): 75-86. DOI: 10.1016/ j.ophtha.2018.07.013.Bailey C, Scott LJ, Rogers CA, et al. Intralesional macular atrophy in anti-vascular endothelial growth factor therapy for age-related macular degeneration in the IVAN trial. Ophthalmology.2019, 126(1): 75-86. DOI: 10.1016/ j.ophtha.2018.07.013.
16、Horani%20M%2C%20Mahmood%20S%2C%20Aslam%20TM.%20A%20review%20of%20macular%20%0Aatrophy%20of%20the%20retinal%20pigment%20epithelium%20in%20patients%20with%20%0Aneovascular%20age-related%20macular%20degeneration%3A%20what%20is%20the%20%0Alink%3F%20part%20II.%20Ophthalmol%20Ther.%202020%2C%209(1)%3A%2035-75.%20DOI%3A%20%0A10.1007%2Fs40123-019-00227-8.Horani%20M%2C%20Mahmood%20S%2C%20Aslam%20TM.%20A%20review%20of%20macular%20%0Aatrophy%20of%20the%20retinal%20pigment%20epithelium%20in%20patients%20with%20%0Aneovascular%20age-related%20macular%20degeneration%3A%20what%20is%20the%20%0Alink%3F%20part%20II.%20Ophthalmol%20Ther.%202020%2C%209(1)%3A%2035-75.%20DOI%3A%20%0A10.1007%2Fs40123-019-00227-8.
17、Toth CA, Tai V, Pistilli M, et al. Distribution of OCT features within areas of macular atrophy or scar after 2 years of anti-VEGF treatment for neovascular AMD in CATT. Ophthalmol Retina. 2019, 3(4): 316-325. DOI: 10.1016/j.oret.2018.11.011.Toth CA, Tai V, Pistilli M, et al. Distribution of OCT features within areas of macular atrophy or scar after 2 years of anti-VEGF treatment for neovascular AMD in CATT. Ophthalmol Retina. 2019, 3(4): 316-325. DOI: 10.1016/j.oret.2018.11.011.
18、Channa R, Sophie R, Bagheri S, et al. Regression of choroidal neovascularization results in macular atrophy in anti-vascular endothelial growth factor-treated eyes. Am J Ophthalmol. 2015, 159(1): 9-19.e1-2. DOI: 10.1016/ j.ajo.2014.09.012.Channa R, Sophie R, Bagheri S, et al. Regression of choroidal neovascularization results in macular atrophy in anti-vascular endothelial growth factor-treated eyes. Am J Ophthalmol. 2015, 159(1): 9-19.e1-2. DOI: 10.1016/ j.ajo.2014.09.012.
19、Sadda SR, Guymer R, Holz FG, et al. Consensus definition for atrophy associated with age-related macular degeneration on OCT: classification of atrophy report 3. Ophthalmology. 2018, 125(4): 537-548. DOI: 10.1016/j.ophtha.2017.09.028.Sadda SR, Guymer R, Holz FG, et al. Consensus definition for atrophy associated with age-related macular degeneration on OCT: classification of atrophy report 3. Ophthalmology. 2018, 125(4): 537-548. DOI: 10.1016/j.ophtha.2017.09.028.
20、Cukras C, Agrón E, Klein ML, et al. Natural history of drusenoid pigment epithelial detachment in age-related macular degeneration: age-Related Eye Disease Study Report No. 28. Ophthalmology. 2010, 117(3): 489-499. DOI: 10.1016/j.ophtha.2009.12.002.Cukras C, Agrón E, Klein ML, et al. Natural history of drusenoid pigment epithelial detachment in age-related macular degeneration: age-Related Eye Disease Study Report No. 28. Ophthalmology. 2010, 117(3): 489-499. DOI: 10.1016/j.ophtha.2009.12.002.
21、Casswell AG, Kohen D, Bird AC. Retinal pigment epithelial detachments in the elderly: classification and outcome. Br J Ophthalmol. 1985, 69(6): 397-403. DOI: 10.1136/bjo.69.6.397.Casswell AG, Kohen D, Bird AC. Retinal pigment epithelial detachments in the elderly: classification and outcome. Br J Ophthalmol. 1985, 69(6): 397-403. DOI: 10.1136/bjo.69.6.397.
22、Scupola A, Coscas G, Soubrane G, et al. Natural history of macular subretinal hemorrhage in age-related macular degeneration. Ophthalmologica. 1999, 213(2): 97-102. DOI: 10.1159/000027400.Scupola A, Coscas G, Soubrane G, et al. Natural history of macular subretinal hemorrhage in age-related macular degeneration. Ophthalmologica. 1999, 213(2): 97-102. DOI: 10.1159/000027400.
23、Sarks J, Tang K, Killingsworth M, et al. Development of atrophy of the retinal pigment epithelium around disciform scars. Br J Ophthalmol. 2006, 90(4): 442-446. DOI: 10.1136/bjo.2005.083022.Sarks J, Tang K, Killingsworth M, et al. Development of atrophy of the retinal pigment epithelium around disciform scars. Br J Ophthalmol. 2006, 90(4): 442-446. DOI: 10.1136/bjo.2005.083022.
24、Christakis PG, Agrón E, Klein ML, et al. Incidence of macular atrophy after untreated neovascular age-related macular degeneration:age-related eye disease study report 40. Ophthalmology.2020, 127(6): 784-792. DOI: 10.1016/ j.ophtha.2019.11.016.Christakis PG, Agrón E, Klein ML, et al. Incidence of macular atrophy after untreated neovascular age-related macular degeneration:age-related eye disease study report 40. Ophthalmology.2020, 127(6): 784-792. DOI: 10.1016/ j.ophtha.2019.11.016.
25、Sohn EH, Flamme-Wiese MJ, Whitmore SS, et al. Choriocapillaris degeneration in geographic atrophy. Am J Pathol. 2019, 189(7): 1473-1480. DOI: 10.1016/ j.ajpath.2019.04.005.Sohn EH, Flamme-Wiese MJ, Whitmore SS, et al. Choriocapillaris degeneration in geographic atrophy. Am J Pathol. 2019, 189(7): 1473-1480. DOI: 10.1016/ j.ajpath.2019.04.005.
26、Chen L, Messinger JD, Sloan KR, et al. Nonexudative macular neovascularization supporting outer retina in age-related macular degeneration:a clinicopathologic correlation. Ophthalmology. 2020,127(7): 931-947. DOI: 10.1016/j.ophtha.2020.01.040.Chen L, Messinger JD, Sloan KR, et al. Nonexudative macular neovascularization supporting outer retina in age-related macular degeneration:a clinicopathologic correlation. Ophthalmology. 2020,127(7): 931-947. DOI: 10.1016/j.ophtha.2020.01.040.
27、Pfau%20M%2C%20M%C3%B6ller%20PT%2C%20K%C3%BCnzel%20SH%2C%20et%20al.%20Type%201%20choroidal%20%0Aneovascularization%20is%20associated%20with%20reduced%20localized%20%0Aprogression%20of%20atrophy%20in%20age-related%20macular%20%0Adegeneration.%20Ophthalmol%20Retina.%202020%2C%204(3)%3A%20238-248.%20%0ADOI%3A%2010.1016%2Fj.oret.2019.09.016.Pfau%20M%2C%20M%C3%B6ller%20PT%2C%20K%C3%BCnzel%20SH%2C%20et%20al.%20Type%201%20choroidal%20%0Aneovascularization%20is%20associated%20with%20reduced%20localized%20%0Aprogression%20of%20atrophy%20in%20age-related%20macular%20%0Adegeneration.%20Ophthalmol%20Retina.%202020%2C%204(3)%3A%20238-248.%20%0ADOI%3A%2010.1016%2Fj.oret.2019.09.016.
上一篇
下一篇
出版者信息
目录