您的位置: 首页 > 2024年12月 第1卷 第4期 > 文字全文
2023年7月 第38卷 第7期11
目录

Point-wise correlations between 10-2 visual field and regional macular vessel density in early open-angle glaucoma

Point-wise correlations between 10-2 visual field and regional macular vessel density in early open-angle glaucoma

来源期刊: Eye Science | 2024年12月 第1卷 第4期 389-397 发布时间:2024-11-28 收稿时间:2024/12/17 9:23:25 阅读量:74
作者:
关键词:
glaucoma 10-2 visual field OCTA
DOI:
10.12419/es24082801
Received date:
2024-08-28 
Accepted date:
2024-10-16 
Published online:
2024-11-28 
Aims: To explore the point-wise correlations between 10-2 visual field (VF) metrics and macular vessel density, as measured by optical coherence tomography angiography (OCTA), in patients with early open-angle glaucoma (OAG) and healthy controls. Methods: This is a cross-sectional study that retrospectively analyzed data from 54 participants (18 eraly OAG patients and 36 healthy controls) from the Zhongshan Ophthalmic Center. All participants underwent comprehensive ophthalmic examinations, 10-2 VF, and macular OCTA imaging. The correlation between capillary density (CD) in macular subregions and light sensitivity (LS) at corresponding VF test points was analyzed using Pearson's correlation coefficients. Results: The analysis revealed a significant reduction in CD within the inferior macular regions of glaucomatous eyes. Notably, there were strong point-wise correlations between CD and 10-2 VF, particularly in the inferior region of outer ring (peak r = 0.534, P < 0.001). Conclusion: The point-wise correlation between 10-2 VF and macular CDdemonstrates the potential for using CD to predict central VF damage in glaucoma, emphasizing theimportance of macular microcirculation in early disease screening.
Aims: To explore the point-wise correlations between 10-2 visual field (VF) metrics and macular vessel density, as measured by optical coherence tomography angiography (OCTA), in patients with early open-angle glaucoma (OAG) and healthy controls. Methods: This is a cross-sectional study that retrospectively analyzed data from 54 participants (18 early OAG patients and 36 healthy controls) from the Zhongshan Ophthalmic Center. All participants underwent comprehensive ophthalmic examinations, 10-2 VF, and macular OCTA imaging. The correlation between capillary density (CD) in macular subregions and light sensitivity (LS) at corresponding VF test points was analyzed using Pearson's correlation coefficients. Results: The analysis revealed a significant reduction in CD within the inferior macular regions of glaucomatous eyes. Notably, there were strong point-wise correlations between CD and 10-2 VF, particularly in the inferior region of outer ring (peak r = 0.534, P < 0.001). Conclusion: The point-wise correlation between 10-2 VF and macular CDdemonstrates the potential for using CD to predict central VF damage in glaucoma, emphasizing theimportance of macular microcirculation in early disease screening.

HIGHLIGHTS

•This study discovered that early glaucoma patients show reduced capillary density in the inferior macular regions and strongly correlates with 10-2 visual field defects.

•The study introduced the point-wise correlation analysis between visual field sensitivity and macular capillary density, providing a more precise understanding of the relationship between specific visual field test points and their corresponding retinal blood vessel networks.

The findings suggest that measuring blood vessel density could help doctors detect glaucoma earlier and monitor its progression more effectively. This technique might lead to better ways to predict how glaucoma will develop in individual patients.

INTRODUCTION

Glaucoma is a multifactorial degenerative optic neuropathy with complex inheritance, and occurs in all age groups.[1] The visual field (VF) test is an invaluable tool for assessing glaucoma severity and progression,[2] but accumulating evidence has reported that conventional 24-2 standard automated perimetry can underestimate VF damage in the macular area,[3] which is increasingly recognized as a common disease feature in early glaucoma.[4] 10-2 standard automated perimetry with more test points 2° apart is thought to be a better detection tool for early glaucomatous macular damage.[5]

Optical coherence tomography angiography (OCTA) is a non-invasive and dye-free imaging modality that allows qualitative and quantitative assessment of retinal microcirculation,[6-7] which is the main source of nutrition for retinal ganglion cells.[8] Previous studies have demonstrated the important role of decreased retinal capillary density (CD) in the development and progression of glaucoma, as either a primary or secondary effect.[9-10] Yarmohammadi et al.[11] and Pradhan et al.[12] observed lower CD in the intact field or unaffected eyes of glaucomatous eyes, indicating that vascular changes may occur prior to detectable VF damage.

Currently, various studies have been conducted to investigate the structure–function mapping based on hemifields[13] or regions[14] between VF and structural thickness[15] as well as vascular density,[16] while the investigation based on test points is relatively rare. Considering that point-wise correlations between VF metrics measured by conventional 24-2[17] or 10-2[18] perimetry and the thickness of retinal layers have been studied in detail, we wondered if there was a spatial correspondence in the retinal microcirculation and 10-2 VF.

In this study, we analyzed the point-wise correlation and spatial correspondence between 10-2 VF and macular CD measured by OCTA to investigate whether CD could be used to predict early 10-2 VF damage and for early glaucoma screening.

MATERIALS AND METHODS

Subjects

A total of 54 participants compromising of 18 early open-angle glaucoma (OAG) patients and 36 healthy controls from the Zhongshan Ophthalmic Center were recruited for this retrospective, cross-sectional study. Participants were required to be (1) 18 years or older; (2) have a best-corrected visual acuity (BCVA) of at least 20/40; (3) display open angles on gonioscopy; (4) and have a mean deviation (MD) better than -6 dB on the 24-2 VF test. Exclusion criteria included 1) systemic hypertension or diabetes; 2) prior eye surgeries, such as glaucoma or cataract procedures; 3) conditions like ocular trauma, retinal diseases, optic neuritis, or uveitis; 4) unreliable VF tests; 5) low-quality OCTA images or OCT scans.

Normal eyes needed to show a healthy optic disc, an intact neuroretinal rim and retinal nerve fiber layer (RNFL), at least two reliable normal VF tests, and an intraocular pressure (IOP) < 21 mmHg, with no history of elevated IOP. The diagnosis of OAG was based on characteristic optic disc changes and corresponding VF defects, and was confirmed by two glaucoma specialists (F.B.L. and X.L.Z.).

This study was conducted in accordance with the tenets of the Declaration of Helsinki, and it was approved by the Zhongshan Ophthalmic Center, Sun Yet-Sen University, China. Written informed consent wasobtained from all participants.

Ocular examinations

All participants performed a comprehensive ophthalmologic examination, including slit-lamp biomicroscopy, measurement of BCVA, Goldmann applanation tonometry, 24-2 VF test (Carl Zeiss AG,Jena, Germany), measurement of axial length and central corneal thickness using an IOL Master (IOL Master 700,Carl Zeiss Meditec AG, Jena, Germany), digital stereo fundus photography (Nonmyd WX3D; Kowa Company,Ltd., Nagoya, Japan), and optical coherence tomography (OCT) and OCTA imaging.

10-2 visual field test

All participants underwent 10-2 perimetry tests using the Humphrey Field Analyzer (Carl Zeiss AG,Jena, Germany). Reliability criteria were fixation loss ≤ 20%, false-positive rate ≤ 15% and false-negative rate ≤ 33%. The 10-2 VF test assessed 68 points. The light sensitivity (LS) values of each point were recorded for further analysis.

Optical coherence tomography angiography

OCTA imaging was performed using a swept-source OCT device (Triton DRI-OCT 2, Topcon Corporation,Tokyo, Japan). This system employs a 1,050 nm wavelength light source and captures 100,000 A-scans per second. The OCTA scans were centered on the fovea and optic disc, covering a 6 mm × 6 mm area. Images were carefully screened, and those exhibiting artifacts, blurriness, segmentation errors, poor centering, or localized signal loss were excluded from analysis.

The device's proprietary software (IMAGEnet6,version 1.23.15008, Basic License 1) was used to automatically segment the superficial capillary plexus (SCP) in the macular region. The SCP was defined as the layer extending from 2.6 μm beneath the internal limiting membrane to 15.6 μm below the boundary between the inner plexiform and inner nuclear layers. For detailed analysis, the macular OCTA scan area was divided into nine sectors based on the Early Treatment Diabetic Retinopathy Study (ETDRS) grid.[19] This grid consists of a central 1-mm diameter circle, an inner ring (1-3 mm diameter), and an outer ring (3-6 mm diameter). Both the inner and outer rings were further divided into four quadrants (nasal, superior, temporal, and inferior), allowing for sub-regional analysis as described in previous studies.[20-21] CD measurements were obtained using a custom-developed Python script (version 3.5). To focus on the capillary network, large vessels were excluded from the analysis, consistent with methodologies employed in prior research.[22-23]

Statistical analysis

Statistical analyses were performed using R software (version 4.10). Demographic and clinical characteristics were summarized using descriptive statistics, with continuous variables expressed as means ± standard deviations and categorical variables as frequencies and percentages. Between-group comparisons for continuous variables were conducted using independent samples t-tests, while categorical variables were analyzed using Pearson's chi-square tests. The association between OCTA CD and LS at the 68 test points in the 10-2 VF was assessed using Pearson's correlation coefficients. All statistical tests were two-tailed, with a significance level set at P < 0.05.

RESULTS

Baseline characteristics

A total of 54 eyes from 54 participants including 36 normal eyes and 18 early glaucomatous eyes were included in the present analysis. Table 1 provides an overview of the demographic and ocular characteristics of the study participants. The mean age for the normal group is 47.6 years, compared to 49.6 years for the glaucoma group. The proportion of males is 36.1% in the normal group and 44.4% in the glaucoma group. Notably, the IOP is significantly elevated in the glaucoma group, averaging 14.7 mmHg vs. 13.0 mmHg in the normal group (P = 0.021). Among the 18 glaucoma patients, 4 patients were not receiving any intraocular pressure-lowering medication, 8 patients were receiving one medication, 2 patients were receiving two medications, and 4 patients were receiving three medications. Spherical equivalent and axial length show no significant differences between groups. VF assessments reveal that the glaucoma group exhibits significantly greater mean deviation and pattern standard deviation, with P values less than 0.001.

Table 1 Demographic and ocular characteristics of the study subjects

Parameters

Normal (n = 36)

Glaucoma (n = 18)

P value

Age, years

47.6 ± 11.1

49.6 ± 18.3

0.618*

Male (%)

13 (36.1)

8 (44.4)

0.554

IOP, in mmHg

13.0 ± 2.3

14.7 ± 3.1

0.021*

SE, in diopters

-2.5 ± 3.3

-3.5 ± 4.1

0.349*

AL, in mm

24.6 ± 1.2

25.0 ± 1.4

0.194*

10-2 VF MD, in dB

-0.8 ± 1.1

-5.6 ± 3.9

<0.001*

10-2 VF PSD, in dB

1.3 ± 0.4

5.0 ± 4.7

<0.001*

 *Student’s T test; †Chi-square test; IOP, intraocular pressure; SE, spherical equivalent; AL, axial length; VF, visual field; MD, mean deviation; PSD, pattern standard deviation.

Significant inferior macular capillary density loss in glaucoma

The analysis of SCP in the macular region, assessed using the ETDRS grid, revealed significant regional differences between glaucoma patients and normal subjects (Figure 1). Notably, in the inferior regions of both the inner and outer rings, glaucoma patients exhibited significantly lower CD compared to controls (P < 0.05). The reduction in CD was particularly pronounced in the inferior region of the outer ring, where the difference was highly significant (mean CD: 35.7% ± 3.1% vs 32.4% ± 3.6%, P = 0.001).
In contrast, no significant differences were observed in the superior, nasal, and temporal regions of both the inner and outer rings between the two groups (P > 0.05). These results highlight a specific pattern of vascular compromise in the inferior regions of macular area in glaucoma patients, while other regions remain unaffected.

Point-wise correlations between macular subregional CD and 10-2 VF

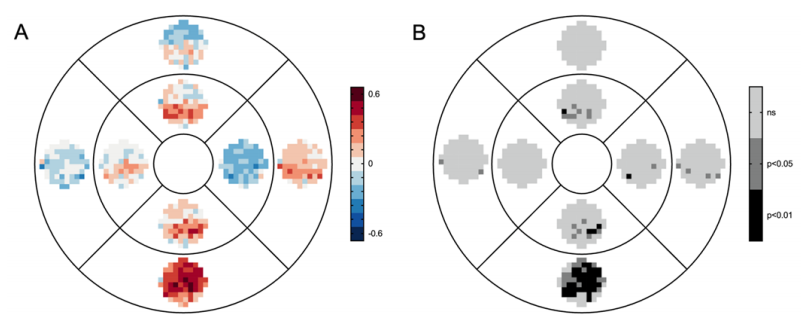
Point-wise correlation was used to clarify the mapping of 10-2 VF and subregional CD within macular zone. The inferior regions of both the inner and outer rings demonstrated positive correlations with 10-2 VF. Notably, Figure 2A showed that the CD in the outer inferior region exhibited strong correlations with nearly all test points (peak r = 0.534, P < 0.001). The statistical significance of these correlations was summarized in Figure 2B. In contrast, other macular regions did not show significant correlations with 10-2 VF, except for weak correlations in the outer nasal region, which lacked spatial correspondence (peak r = 0.332, P = 0.014). Unexpectedly, isolated points in the inner nasal and outer temporal regions displayed significant negative correlations, possibly attributable to measurement errors. These findings underscore a complex relationship between regional macular vasculature and visual function in glaucoma, with a particular emphasis on the inferior macular regions.
Figure 1 Significant inferior macular capillary density loss in glaucoma
Panel A depicts the comparison of subregional CD within the inner ring of the macular area's SCP between normal controls and glaucomatous eyes, while Panel B illustrates similar comparisons within the outer ring. ns, no significance; *, P < 0.05; **, P < 0.01.

Figure 2 Point-wise correlations between macular subregional CD and 10-2 VF
Panel A shows the strength of correlations between the LS values at each test point and the subregional CD in the macular area, color-coded as shown by the legend. Panel B shows the level of statistical significance of the correlations between the subregional CD and the LS values. ns, no significance.

DISCUSSION

This study emphasizes the complex relationship between macular microcirculation and central visual function in early OAG by exploring the point-wise correlation between subregional macular CD and 10-2 VF. Our study indicate that, compared to normal controls, the CD in the inferior macular region of glaucoma patients is significantly reduced, especially in the outer ring, and shows a positive correlation with the LS of nearly all tested points. This finding highlights the vascular-function relationship and spatial correlation between vascular damage in the inferior macular region and central visual function impairment.

Compared with subjective VF examination, OCTA is a fast and objective test providing non-invasive, reproducible qualitative and quantitative evaluation of the retinal microvasculature.[6,16] An increasing number of studies have demonstrated a strong correlation between 24-2 VF defects and a reduction in CD in the ONH and macula regions,[11,24] which is even stronger than the structure–function relationship between ganglion cell-inner plexiform layer thickness or RNFL thickness and 24-2 VF defects.[24–26] This study aimed to explore the vascular-function relationship between macular microcirculation and central visual function.

In our study, we found a significant correlation between vascular damage in the inferior macular region and central visual function impairment. Specifically, our results showed that the CD in the inferior macular region, particularly in the outer ring, was significantly reduced in glaucoma patients compared to normal controls (mean CD: 35.7% ± 3.1% vs 32.4% ± 3.6%, P = 0.001).

The vasculature–function relationship between 24-2 VF LS and the matched macular sectoral CD has been described in patients with POAG, with the correlation coefficients ranging from 0.295 to 0.433.[16] In addition, in pre-perimetric POAG[8] or glaucomatous eyes without detectable 10-2 VF defects,[27] damage to macular microvasculature was prominent in the perifoveal area, which is equivalent to the outer ring in our study, and exhibited a stronger spatial correspondence in the inferior sector. Similarly, in our study, the point-wise correlation between 10-2 VF and inferior macular CD further supports this observation, showing a stronger correlation with a peak of 0.534. Interestingly, when we compared the average correlation coefficients between the superior and inferior hemifields of the 10-2 VF, we found that the average correlation coefficient between the superior hemifield and the CD in outer inferior ring was 0.35 ± 0.11, significantly higher than the 0.30 ± 0.14 observed for the inferior hemifield. This finding indicates that the
spatial correspondence is consistent with the known anatomical relationship between the inferior retina and the superior visual field.

These findings have important clinical implications. Firstly, they suggest that OCTA could potentially serve as a valuable tool for early glaucoma screening and monitoring. Particularly, the reduction in CD in the inferior macular region might be a sensitive indicator of early glaucoma, even before functional deficits are detectable in conventional perimetry. Secondly, this understanding of the vascular-function relationship may help improve predictive models of glaucoma progression, thereby optimizing patient management strategies.

Limitations of this study include the small sample size, single-ethnicity population (all Chinese), and lack of OCT structural parameters in our analysis. These factors limit the generalizability of our findings and prevent a comprehensive assessment of structure-vasculature-function relationships. Additionally, as a cross-sectional study, it only captures a snapshot of the macular capillary density-visual field sensitivity relationship. Future longitudinal research, incorporating OCT measurements and considering factors like medication types, could provide more comprehensive insights into macular microcirculation's role in glaucoma progression.

CONCLUSION

This study establishes a significant point-wise correlation between the 10-2 VF and macular subregional CD in patients with early OAG. It underscores that diminished CD, particularly in the inferior macular region, is associated with reduced central visual function. These findings suggest that OCTA may serve as a valuable tool for predicting central VF metrics and for early screening of glaucoma.

Correction notice

None

Acknowledgement

We thank all staff in clinical research center of ZOC for their effort in this study.

Author Contributions

(Ⅰ) Conception and design: Jiaxuan Jiang, Fengbin Lin
(Ⅱ) Administrative support: Fengbin Lin, Xiulan Zhang
(Ⅲ) Provision of study materials or patients: Jiaxuan Jiang, Deming Wang, Zefeng Yang, Xiaoyi Liu
(Ⅳ) Collection and assembly of data: Jiaxuan Jiang, Deming Wang, Zefeng Yang, Xiaoyi Liu
(Ⅴ) Data analysis and interpretation: Jiaxuan Jiang, Deming Wang, Zefeng Yang, Xiaoyi Liu
(Ⅵ) Manuscript writing: Jiaxuan Jiang
(Ⅶ) Final approval of manuscript: All authors

Funding

This work was supported by the National Key Research and Development Program of China (2022YFC2502800), the National Natural Science Foundation of China (82070955), the Science and Technology Program of Guangzhou, China (2024A03J0250).

Conflict of Interests

None of the authors has any conflicts of interest to disclose. All authors have declared in the completed the ICMJE uniform disclosure form.

Patient consent for publication

Written informed consent was obtained from all participants.

Ethical Statement

This observational cross-sectional study was approved by the Ethics Review Committee of the Zhongshan Ophthalmic Center (2019KYPJ079).

Provenance and Peer Review

This article was a standard submission to our journal. The article has undergone peer review with our anonymous review system.

Data Sharing Statement

None

Open Access Statement

This is an Open Access article distributed in accordance with the Creative Commons Attribution-NonCommercial-NoDerivs 4.0 International License (CC BY-NC-ND 4.0), which permits the non-commercial replication and distribution of the article with the strict proviso that no changes or edits are made and the original work is properly cited (including links to both the formal publication through the relevant DOI and the license)

1、Kang JM, Tanna AP. Glaucoma. Med Clin North Am. 2021,105(3):493-510. DOI: 10.1016/j.mcna.2021.01.004.Kang JM, Tanna AP. Glaucoma. Med Clin North Am. 2021,105(3):493-510. DOI: 10.1016/j.mcna.2021.01.004.
2、Wu Z, Medeiros FA. Recent developments in visual field testing for glaucoma. Curr Opin Ophthalmol. 2018, 29(2): 141-146. DOI: 10.1097/ICU.0000000000000461.Wu Z, Medeiros FA. Recent developments in visual field testing for glaucoma. Curr Opin Ophthalmol. 2018, 29(2): 141-146. DOI: 10.1097/ICU.0000000000000461.
3、De Moraes CG, Hood DC, Thenappan A, et al. 24-2 visual fields miss central defects shown on 10-2 tests in glaucoma suspects, ocular hypertensives, and early glaucoma. Ophthalmology. 2017, 124(10): 1449-1456. DOI: 10.1016/j.ophtha.2017.04.021.De Moraes CG, Hood DC, Thenappan A, et al. 24-2 visual fields miss central defects shown on 10-2 tests in glaucoma suspects, ocular hypertensives, and early glaucoma. Ophthalmology. 2017, 124(10): 1449-1456. DOI: 10.1016/j.ophtha.2017.04.021.
4、Hood DC, Raza AS, de Moraes CGV, et al. Glaucomatous damage of the macula. Prog Retin Eye Res. 2013, 32: 1-21. DOI: 10.1016/j.preteyeres.2012.08.003.Hood DC, Raza AS, de Moraes CGV, et al. Glaucomatous damage of the macula. Prog Retin Eye Res. 2013, 32: 1-21. DOI: 10.1016/j.preteyeres.2012.08.003.
5、Traynis I, De Moraes CG, Raza AS, et al. Prevalence and nature of early glaucomatous defects in the central 10° of the visual field. JAMA Ophthalmol. 2014, 132(3): 291- 297. DOI: 10.1001/jamaophthalmol.2013.7656.Traynis I, De Moraes CG, Raza AS, et al. Prevalence and nature of early glaucomatous defects in the central 10° of the visual field. JAMA Ophthalmol. 2014, 132(3): 291- 297. DOI: 10.1001/jamaophthalmol.2013.7656.
6、de Carlo TE, Romano A, Waheed NK, et al. A review of optical coherence tomography angiography (OCTA). Int J Retina Vitreous. 2015, 1: 5. DOI: 10.1186/s40942-015- 0005-8.de Carlo TE, Romano A, Waheed NK, et al. A review of optical coherence tomography angiography (OCTA). Int J Retina Vitreous. 2015, 1: 5. DOI: 10.1186/s40942-015- 0005-8.
7、Rao HL, Pradhan ZS, Suh MH, et al. Optical coherence tomography angiography in glaucoma. J Glaucoma. 2020, 29(4): 312-321. DOI: 10.1097/IJG.0000000000001463.Rao HL, Pradhan ZS, Suh MH, et al. Optical coherence tomography angiography in glaucoma. J Glaucoma. 2020, 29(4): 312-321. DOI: 10.1097/IJG.0000000000001463.
8、Lu P, Xiao H, Liang C, et al. Quantitative analysis of microvasculature in macular and peripapillary regions in early primary open-angle glaucoma. Curr Eye Res. 2020, 45(5): 629-635. DOI: 10.1080/02713683.2019.1676912.Lu P, Xiao H, Liang C, et al. Quantitative analysis of microvasculature in macular and peripapillary regions in early primary open-angle glaucoma. Curr Eye Res. 2020, 45(5): 629-635. DOI: 10.1080/02713683.2019.1676912.
9、Lee EJ, Lee KM, Lee SH, et al. OCT angiography of the peripapillary retina in primary open-angle glaucoma. Invest Ophthalmol Vis Sci. 2016, 57(14): 6265-6270. DOI: 10.1167/iovs.16-20287.Lee EJ, Lee KM, Lee SH, et al. OCT angiography of the peripapillary retina in primary open-angle glaucoma. Invest Ophthalmol Vis Sci. 2016, 57(14): 6265-6270. DOI: 10.1167/iovs.16-20287.
10、Van Melkebeke L, Barbosa-Breda J, Huygens M, et al. Optical coherence tomography angiography in glaucoma: a review. Ophthalmic Res. 2018, 60(3): 139-151. DOI: 10.1159/000488495.Van Melkebeke L, Barbosa-Breda J, Huygens M, et al. Optical coherence tomography angiography in glaucoma: a review. Ophthalmic Res. 2018, 60(3): 139-151. DOI: 10.1159/000488495.
11、Yarmohammadi A, Zangwill LM, Manalastas PIC, et al. Peripapillary and macular vessel density in patients with primary open-angle glaucoma and unilateral visual field loss. Ophthalmology. 2018, 125(4): 578-587. DOI: 10.1016/j.ophtha.2017.10.029.Yarmohammadi A, Zangwill LM, Manalastas PIC, et al. Peripapillary and macular vessel density in patients with primary open-angle glaucoma and unilateral visual field loss. Ophthalmology. 2018, 125(4): 578-587. DOI: 10.1016/j.ophtha.2017.10.029.
12、Pradhan ZS, Dixit S, Sreenivasaiah S, et al. A sectoral analysis of vessel density measurements in perimetrically intact regions of glaucomatous eyes: an optical coherence tomography angiography study. J Glaucoma. 2018, 27(6): 525-531. DOI: 10.1097/IJG.0000000000000950.Pradhan ZS, Dixit S, Sreenivasaiah S, et al. A sectoral analysis of vessel density measurements in perimetrically intact regions of glaucomatous eyes: an optical coherence tomography angiography study. J Glaucoma. 2018, 27(6): 525-531. DOI: 10.1097/IJG.0000000000000950.
13、Monsalve B, Ferreras A, Khawaja AP, et al. The relationship between structure and function as measured by OCT and Octopus perimetry. Br J Ophthalmol. 2015, 99(9): 1230-1235. DOI: 10.1136/bjophthalmol-2014-305888.Monsalve B, Ferreras A, Khawaja AP, et al. The relationship between structure and function as measured by OCT and Octopus perimetry. Br J Ophthalmol. 2015, 99(9): 1230-1235. DOI: 10.1136/bjophthalmol-2014-305888.
14、Jung KI, Ryu HK, Hong KH, et al. Simultaneously performed combined 24-2 and 10-2 visual field tests in glaucoma. Sci Rep. 2021, 11(1): 1227. DOI: 10.1038/s41598-020-80318-w.Jung KI, Ryu HK, Hong KH, et al. Simultaneously performed combined 24-2 and 10-2 visual field tests in glaucoma. Sci Rep. 2021, 11(1): 1227. DOI: 10.1038/s41598-020-80318-w.
15、Christopher M, Bowd C, Proudfoot JA, et al. Deep learning estimation of 10-2 and 24-2 visual field metrics based on thickness maps from macula OCT. Ophthalmology. 2021, 128(11): 1534-1548. DOI: 10.1016/j.ophtha.2021.04.022.Christopher M, Bowd C, Proudfoot JA, et al. Deep learning estimation of 10-2 and 24-2 visual field metrics based on thickness maps from macula OCT. Ophthalmology. 2021, 128(11): 1534-1548. DOI: 10.1016/j.ophtha.2021.04.022.
16、Tao A, Liang Y, Chen J, et al. Structure-function correlation of localized visual field defects and macular microvascular damage in primary open-angle glaucoma. Microvasc Res. 2020, 130: 104005. DOI: 10.1016/j.mvr.2020.104005.Tao A, Liang Y, Chen J, et al. Structure-function correlation of localized visual field defects and macular microvascular damage in primary open-angle glaucoma. Microvasc Res. 2020, 130: 104005. DOI: 10.1016/j.mvr.2020.104005.
17、Kanamori A, Naka M, Nagai-Kusuhara A, et al. Regional relationship between retinal nerve fiber layer thickness and corresponding visual field sensitivity in glaucomatous eyes. Arch Ophthalmol. 2008, 126(11): 1500-1506. DOI: 10.1001/archopht.126.11.1500.Kanamori A, Naka M, Nagai-Kusuhara A, et al. Regional relationship between retinal nerve fiber layer thickness and corresponding visual field sensitivity in glaucomatous eyes. Arch Ophthalmol. 2008, 126(11): 1500-1506. DOI: 10.1001/archopht.126.11.1500.
18、Cirafici P, Maiello G, Ancona C, et al. Point-wise correlations between 10-2 Humphrey visual field and OCT data in open angle glaucoma. Eye. 2021, 35(3): 868-876. DOI: 10.1038/s41433-020-0989-7.Cirafici P, Maiello G, Ancona C, et al. Point-wise correlations between 10-2 Humphrey visual field and OCT data in open angle glaucoma. Eye. 2021, 35(3): 868-876. DOI: 10.1038/s41433-020-0989-7.
19、Jung JJ, Soh YQ, Sha P, et al. Effects of induced astigmatism on spectral domain-OCT angiography quantitative metrics. Am J Ophthalmol. 2020, 219: 49-58. DOI: 10.1016/j.ajo.2020.07.005.Jung JJ, Soh YQ, Sha P, et al. Effects of induced astigmatism on spectral domain-OCT angiography quantitative metrics. Am J Ophthalmol. 2020, 219: 49-58. DOI: 10.1016/j.ajo.2020.07.005.
20、Huang S, Zhang S, Wang J, et al. Correlation between serum cystatin C level and retinal blood flow in patients with essential hypertension. Ophthalmic Res, 2022, 65(3): 335-341. DOI: 10.1159/000522219.Huang S, Zhang S, Wang J, et al. Correlation between serum cystatin C level and retinal blood flow in patients with essential hypertension. Ophthalmic Res, 2022, 65(3): 335-341. DOI: 10.1159/000522219.
21、Park KS, Lim HB, Shin YI, et al. Effect of axial length on peripapillary microvasculature: an optical coherence tomography angiography study. PLoS One. 2021, 16(10): e0258479. DOI: 10.1371/journal.pone.0258479.Park KS, Lim HB, Shin YI, et al. Effect of axial length on peripapillary microvasculature: an optical coherence tomography angiography study. PLoS One. 2021, 16(10): e0258479. DOI: 10.1371/journal.pone.0258479.
22、Lin F, Li F, Gao K, et al. Longitudinal changes in macular optical coherence tomography angiography metrics in primary open-angle glaucoma with high myopia: a prospective study. Invest Ophthalmol Vis Sci. 2021, 62(1): 30. DOI: 10.1167/iovs.62.1.30.Lin F, Li F, Gao K, et al. Longitudinal changes in macular optical coherence tomography angiography metrics in primary open-angle glaucoma with high myopia: a prospective study. Invest Ophthalmol Vis Sci. 2021, 62(1): 30. DOI: 10.1167/iovs.62.1.30.
23、Lin F, Qiu Z, Li F, et al. Macular and submacular choroidal microvasculature in patients with primary o p e n - a n g l e g l a u c o m a a n d h i g h m y o p i a . B r J Ophthalmol. 2023, 107(5): 650-656. DOI: 10.1136/bjophthalmol-2021-319557.Lin F, Qiu Z, Li F, et al. Macular and submacular choroidal microvasculature in patients with primary o p e n - a n g l e g l a u c o m a a n d h i g h m y o p i a . B r J Ophthalmol. 2023, 107(5): 650-656. DOI: 10.1136/bjophthalmol-2021-319557.
24、Lin YH, Huang SM, Yeung L, et al. Correlation of visual field with peripapillary vessel density through optical coherence tomography angiography in normal-tension glaucoma. Transl Vis Sci Technol. 2020, 9(13): 26. DOI: 10.1167/tvst.9.13.26.Lin YH, Huang SM, Yeung L, et al. Correlation of visual field with peripapillary vessel density through optical coherence tomography angiography in normal-tension glaucoma. Transl Vis Sci Technol. 2020, 9(13): 26. DOI: 10.1167/tvst.9.13.26.
25、Shin JW, Kwon J, Lee J, et al. Relationship between vessel density and visual field sensitivity in glaucomatous eyes with high myopia. Br J Ophthalmol. 2018: bjophthalmol-bjophtha2018-312085. DOI: 10.1136/bjophthalmol-2018-312085.Shin JW, Kwon J, Lee J, et al. Relationship between vessel density and visual field sensitivity in glaucomatous eyes with high myopia. Br J Ophthalmol. 2018: bjophthalmol-bjophtha2018-312085. DOI: 10.1136/bjophthalmol-2018-312085.
26、Shin JW, Lee J, Kwon J, et al. Relationship between macular vessel density and central visual field sensitivity at different glaucoma stages. Br J Ophthalmol. 2019, 103(12): 1827-1833. DOI: 10.1136/bjophthalmol-2018-313019.Shin JW, Lee J, Kwon J, et al. Relationship between macular vessel density and central visual field sensitivity at different glaucoma stages. Br J Ophthalmol. 2019, 103(12): 1827-1833. DOI: 10.1136/bjophthalmol-2018-313019.
27、Lu P, Xiao H, Chen H, et al. Asymmetry of macular vessel density in bilateral early open-angle glaucoma with unilateral central 10-2 visual field loss. J Glaucoma. 2020, 29(10): 926-931. DOI: 10.1097/IJG.0000000000001578.Lu P, Xiao H, Chen H, et al. Asymmetry of macular vessel density in bilateral early open-angle glaucoma with unilateral central 10-2 visual field loss. J Glaucoma. 2020, 29(10): 926-931. DOI: 10.1097/IJG.0000000000001578.
1、This work was supported by the National Key Research and Development Program of China (2022YFC2502800), the National Natural Science Foundation of China (82070955), the Science and Technology Program of Guangzhou, China (2024A03J0250).()
上一篇
下一篇
出版者信息
目录