INTRODUCTION
High myopia, which is defined as a spherical equivalent (SE) of less than -6 diopters (D) or an axial length (AL) exceeding 26 mm, has been rapidly escalating in prevalence worldwide, particularly in East and Southeast Asia.[1, 2] High myopic individuals are at an increased risk of developing sight-threatening commodities, including cataracts. Specifically, each additional diopter of myopia is associated with a 39% and 20% increase in the risk of nuclear and posterior subcapsular cataracts, respectively.[3, 4] Despite advancements in instrumentation and surgical techniques, cataract surgery in highly myopic eyes remains a challenging procedures.[5-9] Most surgeons prefer to implant a monofocal intraocular lens (IOL) in these patients due to their relatively poor visual prognosis and high risk of IOL tilt and decentration.[8, 9]
Numerous studies have demonstrated that near vision is just as important as distance vision for overall visual function and quality of life.[10-12] Unaided near tasks, such as self-care and the use of digital devices, represent the primary visual function needs of individuals, especially those with low vision.[13] Highly myopic cataract patients are accustomed to seeing near objects without correction,[14, 15] and therefore, a myopic postoperative target refraction is generally preferred for them, as opposed to targeting emmetropia in normal cataract patients. However, there is currently no consensus on the level of myopia to target, nor on whether astigmatism correction should be fully considered for highly myopic cataract patients who require distance glasses after cataract surgery. Previous studies have primarily focused on the distance visual acuity of high myopic patients after cataract surgery, [16, 17] but the distribution of near visual acuity in this population remains largely unknown.
The aim of the present study was to evaluate the distribution of near visual acuity and the related postoperative refractive outcomes in highly myopic patients who underwent monofocal IOL implantation. This assessment was based on real-world data sourced from the largest tertiary eye hospital in China, aiming to provide insights for optimizing surgical planning for this patient group in clinical practice.
METHODS
This cross-sectional study was carried out at the Zhongshan Ophthalmic Center, Sun Yat-sen University, Guangzhou, Guangdong, China. The Institutional Review Board provided approval for the study (2019KYPJ033), and all study procedures strictly adhered to the principles outline in the Declaration of Helsinki. Written informed consent was obtained from every participant before their enrollment in the study. Notably, neither patients nor the general public were involved in the design, execution, reporting, or dissemination plans of our research.
Study population
Patients with an AL exceeding 26 mm who underwent phacoemulsification combined with primary IOL implantation were recruited from the cataract department during the period from October 2019 to September 2022. Patients exhibiting any of the following conditions were excluded from the analysis: (1) a history of ocular trauma and surgery, including pars plana vitrectomy, corneal refractive surgery, etc.; (2) ocular comorbidities not associated with high myopia, such as keratitis; (3) implantation of multifocal or toric IOLs ; (4) intraoperative or postoperative complications; (5) undergoing additional procedures during cataract surgery, such as vitrectomy, silicone oil removal, etc.; and (6) non-compliance with the study protocol regarding related examinations. In instances where both eyes met the inclusion criteria, the right eye was chosen for analysis.
Questionnaire and examination
Patients were interviewed and underwent examinations indoors, under ambient lighting conditions at least three months post-cataract surgery. A concise questionnaire was employed to gather information regarding patients’ age, sex, history of ocular and systemic diseases and surgeries, as well as their highest level of education attained. Body mass index (BMI) was computed based on the measured height and weight of the patients. Uncorrected near visual acuity (UCNVA) was assessed at a distance of 40 cm using a logarithm of the minimum angle of resolution (LogMAR) Early Treatment of Diabetic Retiopathy Study (ETDRS) tumbling E chart for near vision (Precision Vision, La Salle, Illinois, USA). Additional ocular examinations encompassed non-cycloplegic subjective refraction, slit-lamp and fundus examinations, non-contact intraocular pressure measurements, and ocular biometry measured with the IOLMaster 700 (Carl Zeiss Meditec AG, Jena, Germany).
Data management
In accordance with the World Health Organization’s definition of visual impairment and blindness, the UCNVA measured at 40 cm was categorized into five categories: ≥ 20/40, 20/40 to 20/60, 20/60 to 20/200, 20/200 to 20/400, and less than 20/400. Age was segmented into four groups: ≤ 50 years, 50 to 60 years, 60 to 70 years, and ≥ 70 years. Education attainment was divided into three categories: less than 10 years of education, high school diploma, and a university degree or higher. Based on the World Health Organization guidelines, BMI was used to identify patients overweight or obese, defined as having a BMI of 25.0 kg/m2 or higher, . AL was categorized into three groups: 26 to 28 mm, 28 to 30 mm, and ≥ 30 mm. Postoperative SE was classified as follows: ≥ -0.5 D, -1.5 to -0.5 D, -2.5 to -1.5 D, -3.5 to -2.5 D, and < -3.5 D. Postoperative astigmatism was categorized based on both magnitude (≥ -1 D, -2 to -1 D, and < -2 D) and axis (against-the-rule [ATR], oblique, and with-the-rule [WTR]). Best-corrected distance visual acuity (BCDVA) after cataract surgery was divided into three groups: normal vision (≥ 20/40), visual impairment (20/40 to 20/200), and blindness (< 20/200).
Statistical analysis
Categorical data were reported as frequencies along with their corresponding percentages. The Chi-squared test was used to assess whether there were differences in the distribution of UCNVA across various covariates, including age, sex, history of diabetes or hypertension, overweight or obesity, education, axial length, postoperative BCDVA, postoperative SE, as well as the magnitude and type of postoperative astigmatism. Covariates that demonstrated statistically significant differences based on the Chi-squared test were subsequently included in a multiple logistic regression analysis to identify factors associated with near visual impairment (UCNVA less than 20/40), while adjusting for age and sex. Data processing and statistical analysis were conducted using STATA 17 (StataCorp, College Station, Texas), and graphical presentation of the results was performed using R version 4.2.2 (R Foundation for Statistical Computing, Vienna, Austria) .
RESULTS
Demographic and clinical characteristics
A total of 664 patients (664 eyes) with a mean age of 61.71 ± 11.38 years (ranging from 28 to 91 years), were included in this study. The demographic and clinical characteristics of the patients are shown in Table 1. The study population comprised 301 male patients (45.33%), among whom 196 (29.52%) were classified as obese or overweight. In terms of the highest educational attainment, 19.13% of patients (127 patients) had received education less than 10 years, 25.15% (167 patients) had completed high school, and 39.61% (263 patients) had attained a university degree or higher. The mean AL was 29.05 ± 2.31 mm (ranging from 26.01 to 35.85 mm), with the proportion of eyes falling within the ranges of 26 to 28 mm, 28 to 30 mm, and greater than 30 mm being 41.72% (277 eyes), 26.05% (173 eyes), and 32.23% (214 eyes), respectively. Postoperatively, 518 eyes (78.01%) achieved BCDVA of 20/40 or better. The mean SE after cataract surgery was -2.51 ± 1.12 D (ranging from -6.0 to 0.75D). The percentage of eyes within an SE of -0.5 D or greater, between -1.5 to -0.5 D, between -2.5 to -1.5 D, between -3.5 to -2.5 D, and less than -3.5 D was 8.43% (56 eyes), 7.08% (47 eyes), 31.17% (207 eyes), 40.81% (271 eyes), and 12.50% (83 eyes), respectively. Regarding postoperative astigmatism, 453 eyes (68.22%) had less than 1 D of astigmatism, and 466 eyes (70.18%) exhibited ATR astigmatism. The majority of implanted IOLs were one-piece (594 eyes, 89.46%) and hydrophobic acrylic (533 eyes, 80.27%).
Table 1 Demographic and clinical characteristics of participants
|
Parameters
|
Distribution
|
|
Age (years)
|
|
|
≤ 50
|
112 (16.87)
|
|
50 - 60
|
201 (30.27)
|
|
60 - 70
|
183 (27.56)
|
|
≥ 70
|
168 (25.30)
|
|
Sex
|
|
|
Male
|
301 (45.33)
|
|
Female
|
363 (54.67)
|
|
Diabetes
|
53 (7.98)
|
|
Hypertension
|
154 (23.19)
|
|
Overweight/Obesity
|
|
|
Yes
|
196 (29.52)
|
|
No
|
459 (69.13)
|
|
Missing
|
9 (1.36)
|
|
Highest education
|
|
|
< 10 years
|
127 (19.13)
|
|
High school
|
167 (25.15)
|
|
University or higher
|
263 (39.61)
|
|
Missing
|
107 (16.11)
|
|
Axial length (mm)
|
|
|
26 to 28
|
277 (41.72)
|
|
28 to 30
|
173 (26.05)
|
|
≥ 30
|
214 (32.23)
|
|
Postoperative best-corrected visual acuity
|
|
|
≥ 20/40
|
518 (78.01)
|
|
20/40 to 20/200
|
119 (17.92)
|
|
< 20/200
|
27 (4.07)
|
|
Postoperative spherical equivalent (D)
|
|
|
≥ -0.5
|
56 (8.43)
|
|
-1.5 to -0.5
|
47 (7.08)
|
|
-2.5 to -1.5
|
207 (31.17)
|
|
-3.5 to -2.5
|
271 (40.81)
|
|
< -3.5
|
83 (12.50)
|
|
Postoperative astigmatism (D)
|
|
|
≥ -1
|
453 (68.22)
|
|
-2 to -1
|
163 (24.55)
|
|
< -2
|
48 (7.23)
|
|
Type of astigmatism
|
|
|
Against-the-rule
|
466 (70.18)
|
|
Oblique
|
53 (7.98)
|
|
With-the-rule
|
145 (21.84)
|
Data were presented as frequency along with the corresponding percentage.
The distribution of UCNVA
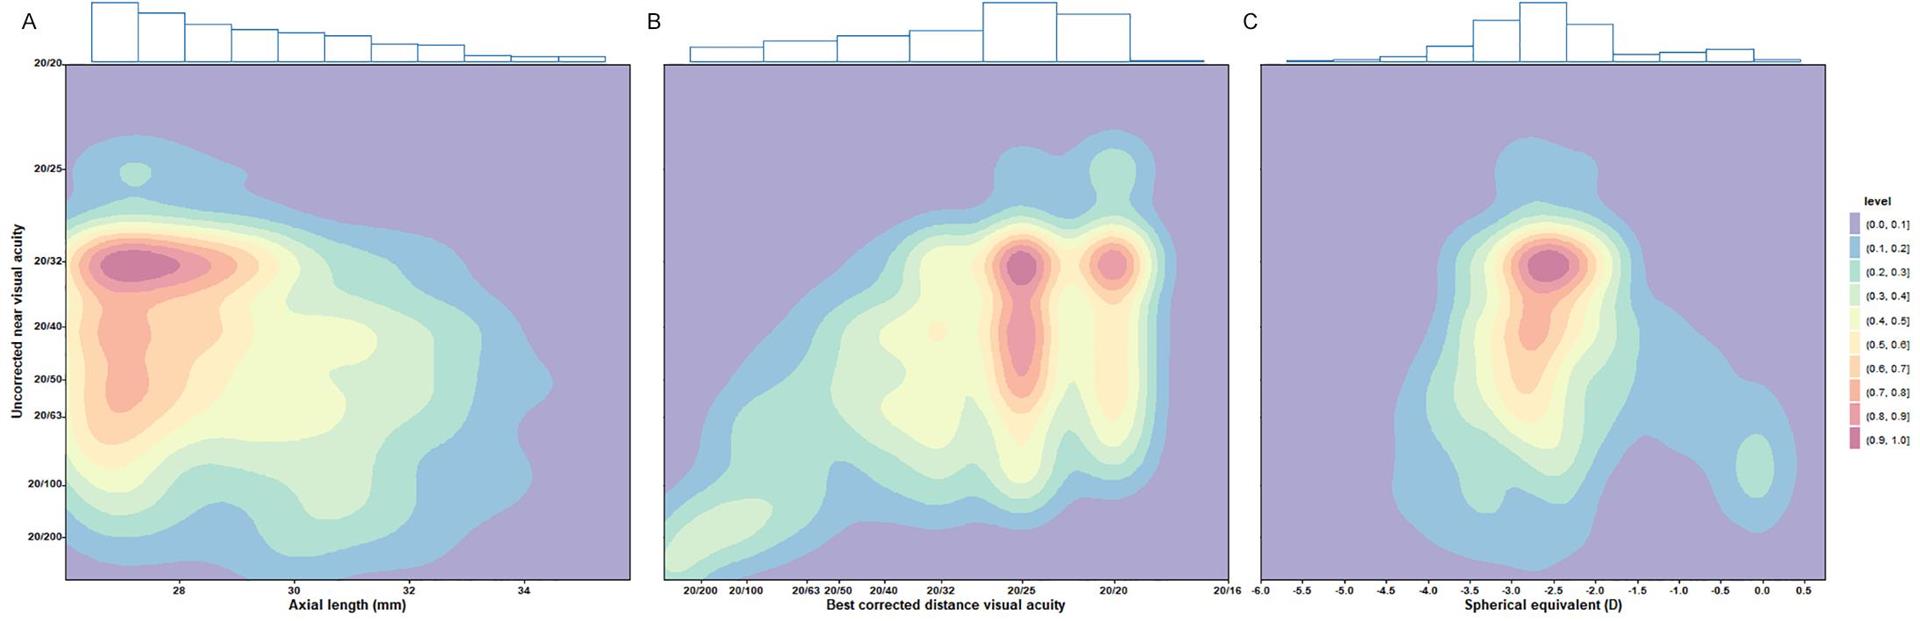
In this study, 319 eyes (48.04%) demonstrated an UCNVA of 20/40 or better. The percentage of eyes with UCNVA in the ranges of 20/40 to 20/60, 20/60 to 20/200, 20/200 to 20/400, and less than 20/400 was 16.11% (107 eyes), 32.68% (217 eyes), 1.96% (13 eyes), and 1.20% (8 eyes), respectively. Table 2 presents the distribution of UCNVA across various subgroups. Notably, significant differences in the distribution of UCNVA were identified among participants with different educational levels , AL, postoperative BCDVA, SE, and amount of astigmatism. Figure 1 illustrates the density distribution along with marginal histograms for UCNVA and parameters such as AL, postoperative BCDVA, and SE.
Figure 1 Density distribution and marginal histograms of uncorrected near visual acuity and parameters including axial length (A), postoperative best-corrected visual acuity (B), and postoperative spherical equivalent (C).
Table 2 Uncorrected near visual acuity of highly myopic eyes after cataract surgery
|
Subgroup
|
Uncorrected near visual acuity
|
P value
|
|
≥ 20/40
|
20/40-20/60
|
20/60-20/200
|
20/200-20/400
|
< 20/400
|
|
Age (years)
|
|
|
|
|
|
0.10
|
|
≤ 50
|
53 (47.32)
|
24 (21.43)
|
32 (28.57)
|
3 (2.68)
|
0 (0)
|
|
|
50 - 60
|
109 (54.23)
|
36 (17.91)
|
50 (24.88)
|
3 (1.49)
|
3 (1.49)
|
|
|
60 - 70
|
84 (45.90)
|
28 (15.30)
|
66 (36.07)
|
3 (1.64)
|
2 (1.09)
|
|
|
≥ 70
|
73 (43.45)
|
19 (11.31)
|
69 (41.07)
|
4 (2.38)
|
3 (1.79)
|
|
|
Sex
|
|
|
|
|
|
0.54
|
|
Male
|
154 (51.16)
|
42 (13.95)
|
96 (31.89)
|
5 (1.66)
|
4 (1.33)
|
|
|
Female
|
165 (45.45)
|
65 (17.91)
|
121 (33.33)
|
8 (2.20)
|
4 (1.10)
|
|
|
Diabetes
|
|
|
|
|
|
0.95
|
|
Yes
|
23 (43.40)
|
9 (16.98)
|
19 (35.85)
|
1 (1.89)
|
1 (1.89)
|
|
|
No
|
296 (48.45)
|
98 (16.04)
|
198 (32.41)
|
12 (1.96)
|
7 (1.15)
|
|
|
Hypertension
|
|
|
|
|
|
0.39
|
|
Yes
|
74 (48.05)
|
22 (14.29)
|
52 (33.77)
|
2 (1.30)
|
4 (2.60)
|
|
|
No
|
245 (48.04)
|
85 (16.67)
|
165 (32.35)
|
11 (2.16)
|
4 (0.78)
|
|
|
Overweight/Obesity
|
|
|
|
|
|
0.98
|
|
Yes
|
96 (48.98)
|
32 (16.33)
|
61 (31.12)
|
4 (2.04)
|
3 (1.53)
|
|
|
No
|
218 (47.49)
|
75 (16.34)
|
152 (33.12)
|
9 (1.96)
|
5 (1.09)
|
|
|
Highest education
|
|
|
|
|
|
0.006a
|
|
< 10 years
|
49 (38.58)
|
14 (11.02)
|
56 (44.09)
|
5 (3.94)
|
3 (2.36)
|
|
|
High school
|
84 (50.30)
|
30 (17.96)
|
49 (29.34)
|
2 (1.20)
|
2 (1.20)
|
|
|
University or higher
|
149 (56.65)
|
37 (14.07)
|
71 (27.00)
|
3 (1.14)
|
3 (1.14)
|
|
|
Axial length (mm)
|
|
|
|
|
|
<0.001a
|
|
26 to 28
|
145 (52.35)
|
45 (16.25)
|
84 (30.32)
|
3 (1.08)
|
0 (0)
|
|
|
28 to 30
|
98 (56.65)
|
21 (12.14)
|
47 (27.17)
|
3 (1.73)
|
4 (2.31)
|
|
|
≥ 30
|
76 (35.51)
|
41 (19.16)
|
86 (40.19)
|
7 (3.27)
|
4 (1.87)
|
|
|
Postoperative best-corrected visual acuity
|
< 0.001a
|
|
≥ 20/40
|
293 (56.56)
|
88 (16.99)
|
137 (26.45)
|
0 (0)
|
0 (0)
|
|
|
20/40 to 20/200
|
26 (21.85)
|
18 (15.13)
|
72 (60.50)
|
3 (2.52)
|
0 (0)
|
|
|
< 20/200
|
0 (0)
|
1 (3.70)
|
8 (29.63)
|
10 (37.04)
|
8 (29.63)
|
|
|
Postoperative spherical equivalent (D)
|
< 0.001a
|
|
≥ -0.5
|
5 (8.93)
|
6 (10.71)
|
41 (73.21)
|
0 (0)
|
4 (7.14)
|
|
|
-1.5 to -0.5
|
13(27.66)
|
14 (29.79)
|
18 (38.30)
|
2 (4.26)
|
0 (0)
|
|
|
-2.5 to -1.5
|
132 (63.77)
|
24 (11.59)
|
48 (23.19)
|
2 (0.97)
|
1 (0.48)
|
|
|
-3.5 to -2.5
|
153 (56.46)
|
46 (16.97)
|
65 (23.99)
|
5 (1.85)
|
2 (0.74)
|
|
|
< -3.5
|
16 (19.28)
|
17 (20.48)
|
45 (54.22)
|
4 (4.82)
|
1 (1.20)
|
|
|
Postoperative astigmatism (D)
|
< 0.001a
|
|
≥ -1
|
248 (54.75)
|
70 (15.45)
|
125 (27.59)
|
3 (0.66)
|
7 (1.55)
|
|
|
-2 to -1
|
58 (35.58)
|
31 (19.02)
|
64 (39.26)
|
9 (5.52)
|
1 (0.61)
|
|
|
< -2
|
13 (27.08)
|
6 (12.50)
|
28 (58.33)
|
1 (2.08)
|
0 (0)
|
|
|
Type of astigmatism
|
|
|
|
|
|
0.44
|
|
Against-the-rule
|
222 (47.64)
|
80 (17.17)
|
149 (31.97)
|
9 (1.93)
|
6 (1.29)
|
|
|
Oblique
|
29 (54.72)
|
7 (13.21)
|
14 (26.42)
|
1 (1.89)
|
2 (3.77)
|
|
|
With-the-rule
|
68 (46.90)
|
20 (13.79)
|
54 (37.24)
|
3 (2.07)
|
0 (0)
|
|
a. Statistically significant (P <0.05).
Data were presented as frequency along with the corresponding percentage.
The associated factors of UCNVA less than 20/40
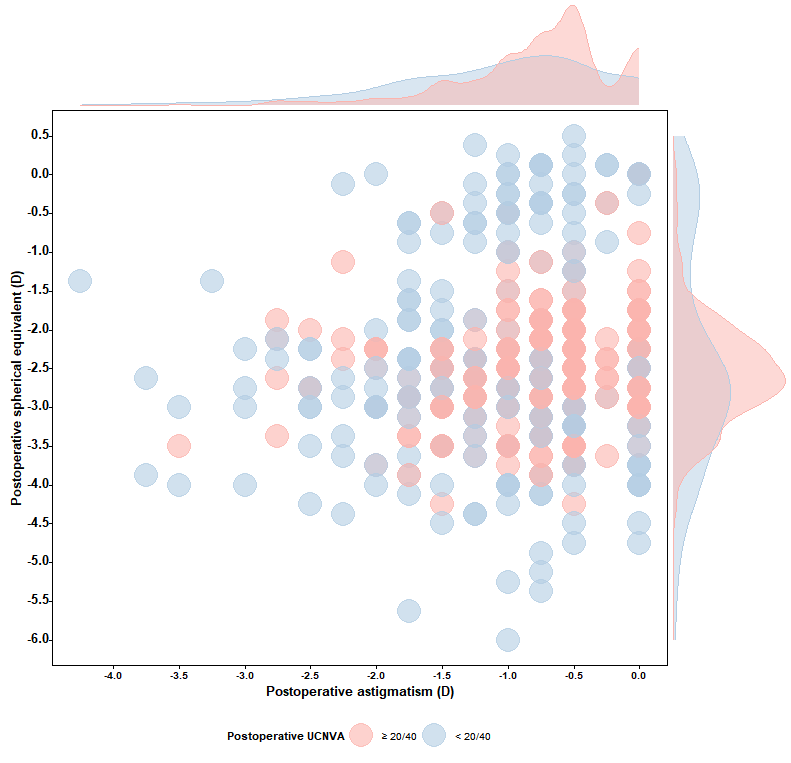
The outcomes of multiple logistic regression analysis are shown in Table 3. Compared to eyes with BCDVA ≥20/40, those with a BCDVA worse than 20/40 exhibited a significantly increased risk of near visual impairment (odds ratio [OR]: 5.44, 95% confidence interval [CI]: 3.14 to 9.42).Furthermore, postoperative astigmatism greater than 1 D was found to be associated with worse UCNVA, Specifically, for eyes with astigmatism in the range of -2 to -1 D, the OR was 2.00 (95% CI: 1.24 to 3.22), and for eyes with astigmatism < -2 D, the OR was 4.27 (95% CI: 1.88 to 9.66). When compared to a postoperative SE of -2.5 D (which corresponds to a theoretical focal length of 40 cm), eyes with a postoperative SE > -1.5 or SE < -3.5 D had a 3.17- to 18.73-fold increased risk of UCNVA < 20/40. Figure 2 illustrates the distribution of postoperative SE and astigmatism in eyes with and without UCNVA ≥ 20/40.
Figure 2 Bubble plot and marginal density curves showing the distribution of postoperative spherical equivalent and astigmatism in eyes with and without near visual impairment (< 20/40)
Only eyes with postoperative best-corrected distance visual acuity better than 20/40 were included (n = 518).
UCNVA = uncorrected near visual acuity.
Table 3 Multiple logistic regression of near vision impairment in highly myopic eyes after cataract surgery
|
|
OR (95% CI)
|
P value
|
|
Highest education
|
|
|
|
< 10 years
|
Ref
|
-
|
|
High school
|
0.85 (0.48, 1.50)
|
0.57
|
|
University or higher
|
0.69 (0.41, 1.18)
|
0.17
|
|
Axial length (mm)
|
|
|
|
26 to 28
|
Ref
|
-
|
|
28 to 30
|
0.79 (0.48, 1.31)
|
0.37
|
|
≥ 30
|
1.35 (0.83, 2.19)
|
0.23
|
|
Postoperative best-corrected visual acuity
|
|
|
|
≥ 20/40
|
Ref
|
-
|
|
< 20/40
|
5.44 (3.14, 9.42)
|
< 0.001a
|
|
Postoperative spherical equivalent (D)
|
|
|
|
-2.5
|
Refb
|
-
|
|
> -0.5
|
19.73 (4.88, 79.68)
|
< 0.001a
|
|
-1 to -0.5
|
13.19 (2.52, 68.94)
|
0.002a
|
|
-1.5 to -1
|
4.96 (1.37, 18.03)
|
0.015a
|
|
-2 to -1.5
|
1.18 (0.45, 3.11)
|
0.74
|
|
-2.5 to -2
|
0.74 (0.32, 1.70)
|
0.48
|
|
-3 to -2.5
|
0.83 (0.38, 1.80)
|
0.64
|
|
-3.5 to -3
|
1.73 (0.75, 4.01)
|
0.20
|
|
-4 to -3.5
|
4.17 (1.56, 11.14)
|
0.004a
|
|
< -4
|
8.51 (2.31, 31.32)
|
0.001a
|
|
Postoperative astigmatism (D)
|
|
|
|
≥ -1
|
Ref
|
-
|
|
-2 to -1
|
2.00 (1.24, 3.22)
|
0.004a
|
|
< -2
|
4.27 (1.88, 9.66)
|
0.001a
|
OR: odds ratio; CI: confidence interval.
Adjusted for age and sex.
a.Statistically significant (P <0.05).
b.The spherical equivalent of -2.5 D was set as the reference, corresponding to a theoretical focal length of 40 cm.
DISCUSSION
Based on a real-world surgical population with a substantial sample size, we reported the distribution and associated factors of UCNVA in highly myopic eyes after phacoemulsification and monofocal IOL implantation. Astigmatism exceeding 1 D and BCDVA less than 20/40 were identified as risk factors contributing to poor UCNVA, whereas a postoperative SE between -3.5 and -1.5 D was more likely to provide UCNVA ≥ 20/40 at 40 cm.
Previous studies have reported the detrimental impact of compromised distance or near vision on quality of life.[11, 12, 17] However, to our knowledge, the distribution of near vision in highly myopic eyes after cataract surgery was largely unknown until this study. Ang et al. reported that the mean postoperative SE and UCNVA of 183 eyes with a mean AL of 26.76 ± 1.75 mm were -0.16± 0.50 D and 0.28 ± 0.22 logMAR, respectively, without further analyzing the UCNVA distribution.[18] In our study, we found that the proportion of eyes with UCNVA ≥ 20/40, 20/40 to 20/60, 20/60 to 20/200, 20/200 to 20/400, and less than 20/400 in highly myopic eyes with monofocal IOL implantation was 48.04%, 16.11%, 32.68%, 1.96%, and 1.20%, respectively. Regarding BCDVA, 518 eyes (78.01%) had a postoperative BCDVA ≥ 20/40, while 17.92% and 4.07% eyes had a BCDVA between 20/40 and 20/200, and < 20/200, respectively. The distribution of BCDVA was similar to that in a previous study in which 68.50% of eyes had a BCDVA greater than 20/40.[16] The difference between the proportion of eyes with BCDVA and UCNVA ≥ 20/40 in this study (78.01% vs 48.04%) highlights the importance of preoperative planning for refractive outcomes in this population.
Targeting an appropriate refraction in highly myopic patients undergoing cataract surgery is a crucial aspect of surgical planning. In our study population, the majority of patients (71.98%) had an SE between -3.5 and -1.5 D after cataract extraction and monofocal IOL implantation. Compared to emmetropic eyes, eyes with a postoperative myopic refraction have been reported to have better near vision and a higher quality of life for near vision activities.[19] It has been reported that long-term myopic patients may express dissatisfaction with an emmetropic target refraction after cataract surgery, due to the inability to read without glasses as they did before surgery.[15] To meet the near vision needs of myopic patients, Kora et al suggested a target refraction of -3 D based on patient preference, by changing their refraction to 0 D, -3 D, and -5 D with soft contact lenses.[14] Hayashi et al found that a myopia of -2 D could gain visual acuity better than 20/30 at 0.3 m, 0.5 m, and 0.7 m.[20] After excluding the interference of BCDVA and astigmatism, we noted that a postoperative SE between -3.5 and -1.5 D was more likely to yield UCDVA ≥ 20/40 at a distance of 40 cm. Since highly myopic patients may have varying preferred reading distances and visual demands, surgeons could tailor the target refraction individually within this range.
Our results showed that astigmatism exceeding 1 D was a significant risk factor for UCNVA less than 20/40. Several studies have suggested that a certain amount of myopic astigmatism (-0.25 D) could increase the depth of focus in patients with monofocal IOL implantation.[21, 22] Singh et al tested high-contrast logMAR distance and near visual acuity in 15 participants wearing -2.5 D myopic to 2.0 D hyperopic astigmatic lenses on different axes at 0.5 D intervals, and reported that myopic astigmatism greater than 1 D did not provide any additional benefit in near visual acuity.[23] Other studies reported that ATR astigmatism resulted in slightly worse distance visual acuity but slightly better near visual acuity compared to WTR astigmatism.[24, 25] In this study, the amount of astigmatism had a significant effect on UCNVA, whereas the type of astigmatism was unrelated. Our study provided novel findings that astigmatism of 1 D or more had a negative effect on UCNVA. For highly myopic eyes with more than 1 D of astigmatism, cataract surgeons should consider astigmatism correction, such as toric IOL implantation or limbal relaxing incisions.
Our study had several limitations that need to be addressed. Firstly, this study measured the UCNVA at 40 cm, given that the definition of near visual impairment by the World Health Organization is near visual acuity <20/40 at 40 cm, rather than each patient's working distance. A subsequent study combining individual working distances may provide more personalized guidance. Secondly, only one eye of a patient was included in the analysis, considering the correlation between two eyes. Further studies are warranted to evaluate binocular visual function and quality of life with different refractive statuses. Lastly, we only included Chinese participants from a single hospital which may introduce selection bias, and further studies in other ethnic populations and settings are warranted to confirm our findings.
In conclusion, postoperative SE, residual astigmatism, and BCDVA were crucial determinants of the UCNVA in highly myopic patients following monofocal IOL implantation. A target refraction between -3.5 and -1.5 D was recommended to achieve an unimpaired UCNVA at 40 cm. Moreover, astigmatic correction should be considered for highly myopic cataract patients with astigmatism exceeding 1 D.
Correction notice
None.
Acknowledgements
None.
Author Contributions
(I) Conception and design: Jiaqing Zhang, Xiaohang Xie, Haowen Lin, Xiaotong Han, and Lixia Luo
(II) Administrative support: Zhenzhen Liu, Xuhua Tan, Guangming Jin, and Xiaoyun Chen
(III) Provision of study materials or patients: Xiaotong Han and Lixia Luo
(IV) Collection and assembly of data: Jiaqing Zhang, Xiaohang Xie, Haowen Lin, Xiaozhang Qiu
(V) Data analysis and interpretation: Jiaqing Zhang and Xiaotong Han
(VI) Manuscript writing: All authors
(VII) Final approval of manuscript: All authors
Conflict of Interests
None of the authors has any conflicts of interest to disclose. All authors have declared in the completed the ICMJE uniform disclosure form.
Patient consent for publication
None
Ethics approval and consent to participate
All study procedures followed the principles of the Declaration of Helsinki and written informed consent was obtained from all participants prior to enrollment. The study protocol was approved by the Ethics Review Committee of Zhongshan Ophthalmic Center, Sun Yat-sen University. No.2019KYPJ033
Data availability statement
None
Open access
This is an Open Access article distributed in accordance with the Creative Commons AttributionNonCommercial-NoDerivs 4.0 International License (CC BY-NC-ND 4.0), which permits the non-commercial replication and distribution of the article with the strict proviso that no changes or edits are made and the original work is properly cited (including links to both the formal publication through the relevant DOI and the license).