您的位置: 首页 > 2024年12月 第1卷 第4期 > 文字全文
2023年7月 第38卷 第7期11
目录

Retinal neurovascular characteristics for the diagnosis and staging of nondiabetic chronic kidney disease: a diagnostic study

Retinal neurovascular characteristics for the diagnosis and staging of nondiabetic chronic kidney disease: a diagnostic study

来源期刊: Eye Science | 2024年12月 第1卷 第4期 358-373 发布时间:2024-12-20 收稿时间:2024/12/17 9:23:11 阅读量:276
作者:
关键词:
Retinal neuorvascular characteristics Chronic kidney disease Optical coherence tomography angiography
DOI:
10.12419/es24072502
Received date:
2024-07-25 
Revised date:
2024-08-09 
Accepted date:
2024-10-12 
Published online:
2024-12-20 
Aims: To identify the characteristic retinal neurovascular changes in patients in different stages of nondiabetic chronic kidney disease (CKD) and to develop a model for the accurate diagnosis of nondiabetic CKD.
Methods: Peripapillary retinal nerve fiber layer (pRNFL) thickness and average macular ganglion cell-inner plexiform layer (GC-IPL) thickness of nondiabetic CKD patients and healthy controls (HC) were evaluated by spectral-domain optical coherence tomography (OCT). The vessel density (VD) and perfusion density (PD) of the macula were obtained from optical coherence tomography angiography (OCTA). The estimated glomerular filtration rate (eGFR) was obtained to access the kidney function of CKD patients. Multiple linear regression models were used to adjust for confounding factors in statistical analyzes. The diagnostic capabilities of the parameters were evaluated by logistic regression models.
Results: 131 nondiabetic CKD patients and 62 HC 
entered the study. eGFR was found significantly associated with parafoveal VD and PD (average PD: β = 0.000 4, Padjusted < 0.001) in various sectors. Thinning of pRNFL (β = -6.725, Padjusted0.001) and GC-IPL (β = -4.542, Padjusted < 0.001), as well as decreased VD (β = -2.107, P- adjusted0.001) and PD (β = -0.057, Padjusted = 0.032 8) were found in CKD patients. Thinning of pRNFL and deteriorated perifoveal vasculature were found in early CKD, and the parafoveal and foveal VD significantly declined in advanced CKD. Logistic regression models were employed, and selected neurovascular parameters showed an AUC of 0.853 (95% Confidence Interval [CI]: 0.795 to 0.910) in distinguishing CKD patients from HC.
Conclusions: Distinctive retinal neurovascular 
characteristics could be observed in nondiabetic CKD patients of different severities. Our results suggest that retinal manifestations could be valuable in the screening, diagnosis, and follow-up evaluation of patients with CKD.
Aims: To identify the characteristic retinal neurovascular changes in patients in different stages of nondiabetic chronic kidney disease (CKD) and to develop a model for the accurate diagnosis of nondiabetic CKD.
Methods: Peripapillary retinal nerve fiber layer (pRNFL) thickness and average macular ganglion cell-inner plexiform layer (GC-IPL) thickness of nondiabetic CKD patients and healthy controls (HC) were evaluated by spectral-domain optical coherence tomography (OCT). The vessel density (VD) and perfusion density (PD) of the macula were obtained from optical coherence tomography angiography (OCTA). The estimated glomerular filtration rate (eGFR) was obtained to access the kidney function of CKD patients. Multiple linear regression models were used to adjust for confounding factors in statistical analyzes. The diagnostic capabilities of the parameters were evaluated by logistic regression models.
Results: 131 nondiabetic CKD patients and 62 HC 
entered the study. eGFR was found significantly associated with parafoveal VD and PD (average PD: β = 0.000 4, Padjusted < 0.001) in various sectors. Thinning of pRNFL (β = -6.725, Padjusted < 0.001) and GC-IPL (β = -4.542, Padjusted < 0.001), as well as decreased VD (β = -2.107, Padjusted < 0.001) and PD (β = -0.057, Padjusted = 0.032 8) were found in CKD patients. Thinning of pRNFL and deteriorated perifoveal vasculature were found in early CKD, and the parafoveal and foveal VD significantly declined in advanced CKD. Logistic regression models were employed, and selected neurovascular parameters showed an AUC of 0.853 (95% Confidence Interval [CI]: 0.795 to 0.910) in distinguishing CKD patients from HC.
Conclusions: Distinctive retinal neurovascular 
characteristics could be observed in nondiabetic CKD patients of different severities. Our results suggest that retinal manifestations could be valuable in the screening, diagnosis, and follow-up evaluation of patients with CKD.

HIGHLIGHTS

• Previous studies have indicated that retinal neurovascular deterioration was present in chronic kidney disease (CKD) patients, and such changes could be captured by retinal photographs or optical coherence tomography angiography (OCTA).

• This study expands the knowledge regarding retinal neurovascular changes obtained by OCTA in nondiabetic CKD patients. Our result has proven the diagnostic ability of retinal neurovascular parameters in distinguishing CKD of different stages.

• Our study provided evidence for applying ocular neurovascular data for CKD stratification, screening and long-term management.

INTRODUCTION

Chronic kidney disease (CKD) poses significant global healthcare challenges with an increasing incidence.[1-3] It was estimated that the worldwide prevalence of CKD has reached 9.1%, and the disease accounts for 4.6% of total mortality worldwide.[4] Current evidence suggests that vascular dysfunction, as a prominent pathogenetic factor of CKD, could be a shared contributor to disease progression[5] and systemic complications such as cardiovascular diseases,[6] metabolic disorders[7] and neuropathies.[6,8-9] However, the pathological changes of vessels in the kidneys and related target organs could hardly be assessed by non-invasive methods due to their anatomic nature, limiting further scientific studies and clinical applications regarding vascular mechanisms.

The eye, often referred to as a window to the body, allows direct visualization of neurovascular structures and provides attainable insights into systemic diseases. Several researchers have successfully assessed ophthalmic manifestations for the diagnosis  and management of extraocular diseases, including cardiovascular diseases,[10] dementia,[11] and hepatobiliary diseases.[12] Additionally, it is known that the eye and the kidney have similar structural and physiological characteristics,[13] particularly the vast microvascular networks in the glomeruli and retina. Deep learning models based on fundus photographs have also been proven successful in detecting CKD patients.[14] Provided that the retinal microvasculature could easily be accessed through non-invasive methods, it is of particular interest to clarify the latent affiliation between ocular manifestations and kidney function.

Several retinal vascular imaging methods have been developed in recent years. Optical coherence tomography angiography (OCTA), developed from optical coherence tomography (OCT), represents a novel, rapid, and non-invasive approach for assessing the microvascular structure of the retina.[15-16] OCTA is used to obtain depth-resolved images of blood flow in the retina and choroid and has been proven to be valuable in screening for various diseases.[17] In a series of recent studies, the application of OCT and OCTA in CKD evaluation and management has been explored.[18-21]

These studies discovered that CKD patients have significantly reduced retinal thickness and vessel density, and the severity is often related with the level of kidney dysfunction. Despite remarkable results, most researchers in previous studies mainly focused on diabetic CKD patients, neglecting the potential bias that the impact of diabetes on ocular microvasculature might introduce to the results.[14,22-24] The pattern of retinal neurovascular deteriorations in CKD patients without the impact of diabetes remains unresolved, hence applying retinal parameters for the management of CKD at this stage lacks comprehensive evidence, and there is an urgent need for more research to support this approach. It is noteworthy that approximately 70% of all CKD has nondiabetic causes, however these patients receive significantly less screening and medical care than diabetic CKD patients despite being the vast majority.[25-26] Therefore, investigating the correlation between CKD and retinal manifestations in nondiabetic cases could bridge existing gaps in current research and enhance clinical strategies.

To illuminate this uncharted area, we conducted an assessment of retinal neurovascular manifestations in patients at various stages of nondiabetic CKD using OCT and OCTA. The results were analyzed to investigate the differences between healthy individuals and patients with different severities and to explore the correlation between kidney function and ocular changes. Furthermore, we developed diagnostic models based on retinal parameters for the classification and staging of CKD, aiming to investigate the potential of retinal parameters as non-invasive and accessible indicators of nondiabetic CKD.

MATERIALS AND METHODS

Participants

Participants were recruited from CKD patients presenting to the Department of Nephrology of the Third Affiliated Hospital, Sun Yat-sen University, Guangzhou, between January and July 2022. CKD diagnosis was made by two experienced nephrologists according to the KDIGO guidelines.[27] The estimated glomerular filtration rate (eGFR) was calculated with the serum creatinine level using the CKD-EPI equation.[28] CKD was further classified into stage 1, (eGFR ≥ 90 mL/min/1.73 m2 ), stage 2 (eGFR between 60–89 mL/min/1.73 m2 ), stage 3 (eGFR between 30–59 mL/min/1.73 m2 ), stage 4 (eGFR between 15–29 mL/min/1.73 m2 ), and stage 5 (eGFR < 15 mL/min/1.73 m2 ). Early CKD was defined as CKD stages 1 to 3, while advanced CKD was defined as CKD stages 4 to 5.[29] Demographic data including age, sex, smoking status, previous diagnosis of hypertension and cardiovascular diseases were extracted from the patients’ electronic health records.

The inclusion criteria for patients in this study were (1) the presence of CKD and (2) ≥ 18 years old. The exclusion criteria were (1) diagnosis of diabetes mellitus; (2) significant ocular media opacity; and (3) presence of other ocular or systemic diseases that are known to affect the retinal structure, such as dementia. The healthy control (HC) group included volunteers from the Zhongshan Ophthalmic Center. The inclusion criteria were as follows: (1) no medical history of systemic or ocular diseases; and (2) normal-appearing fundus.

The study was approved by the Ethics Committee of the Third Affiliated Hospital of Sun Yat-sen University, and Zhongshan Ophthalmic Center, Sun Yat-sen University. It was conducted in accordance with the tenets of the Declaration of Helsinki. Written informed consent was obtained from all participants.

Ocular examinations and OCTA

All participants were given a comprehensive ophthalmic examination composed of best-corrected visual accuracy assessment, slit-lamp biomicroscopy of the anterior segment, dilated fundus examination, OCT, and OCTA. OCT and OCTA results were obtained by an ultraclear OCT and AngioPlex device (Cirrus 5000, version 10.0; Carl Zeiss Meditec Inc., Dublin, CA, USA). Cirrus OCTA software (AngioPlex, version 10.0; Carl Zeiss Meditec Inc.) was used to analyze the scans. Scans with signal strength less than 7/10 were excluded to control image quality. All patients were instructed to remain stationary and fix their gaze on the center of the cross target to minimize motion artifacts. Images with vessel doubling or misalignment and poor positioning were excluded from statistical analysis.

Spectral-domain OCT was used to obtain the thickness of different retinal layers. A 200×200 scan protocol of the optic disc cube was used for peripapillary retinal nerve fiber layer (pRNFL) measurement. pRNFL measurements included the average pRNFL thickness within a 3.46 mm diameter around the optic disc and the thickness of four quadrants (superior, temporal, inferior, and nasal). Macular ganglion cell-inner plexiform layer (GC-IPL) thickness measurements were conducted with a macular cube with 512×128 scan mode. The average GC-IPL thickness and the thickness of six sectors (superior, temporal-superior, temporal-inferior, inferior, nasal-inferior, and nasal-superior) were obtained within a 6 mm diameter centered at the fovea.

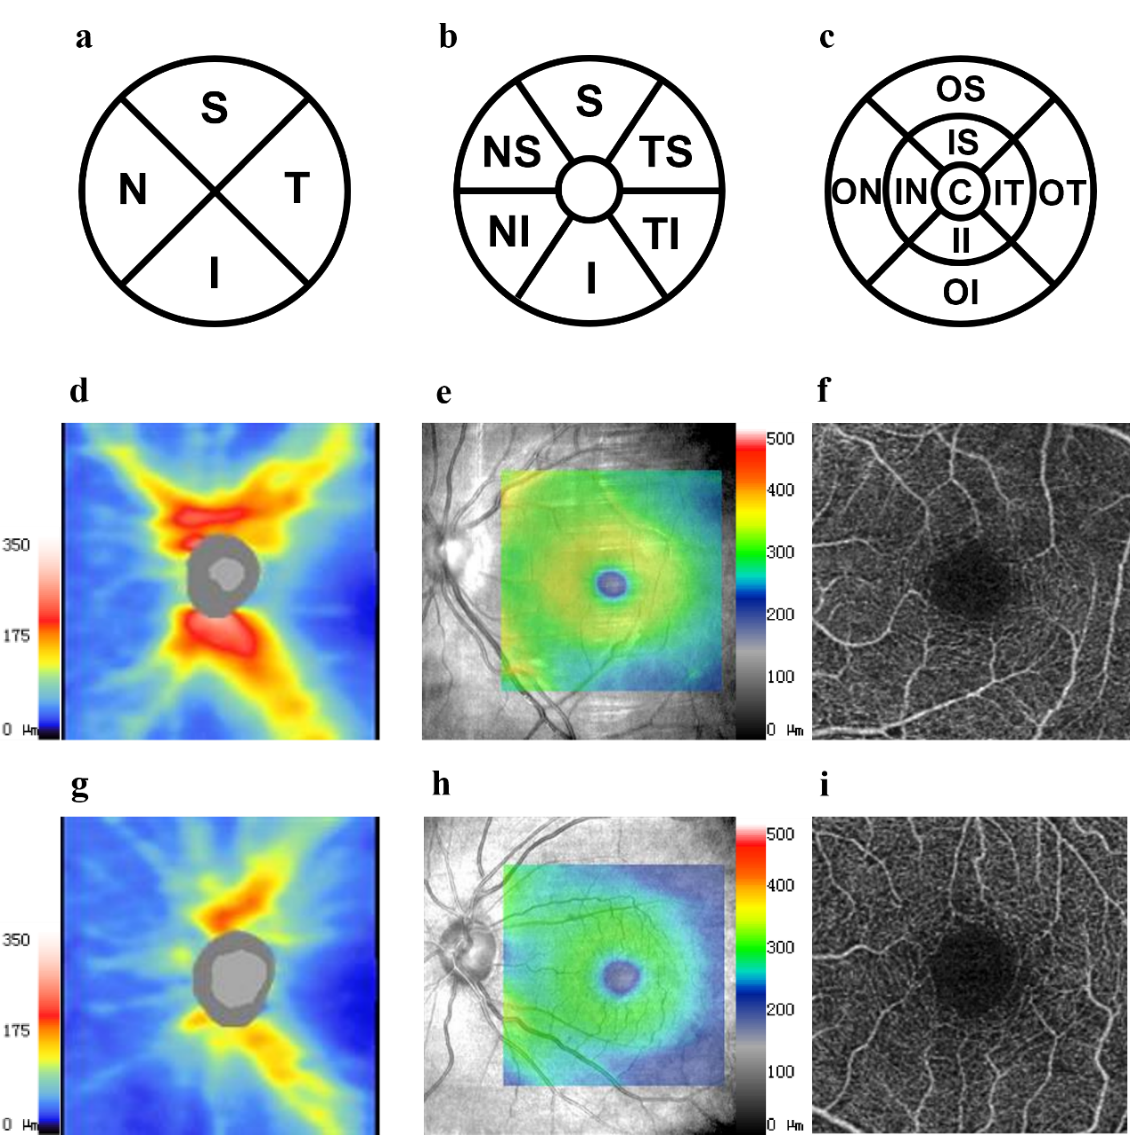
Optical coherence tomography angiography was acquired with a 6×6 mm scan pattern centered at the macula. Vessel density (VD), perfusion density (PD), and foveal avascular zone (FAZ) of the superficial vascular plexus were measured and analyzed with Cirrus OCTA software (AngioPlex, version 10.0; Carl Zeiss Meditec Inc.). VD is the total length of perfused vasculature per unit area, and PD is the total area per unit area. Both VD and PD were measured in an annular zone excluding the FAZ. The scan zone was divided into nine sections: central, inner superior, inner temporal, inner inferior, inner nasal, outer superior, outer temporal, outer inferior, and outer nasal sectors. The central area was 1 mm in diameter, while the inner and outer rings had 3 mm and 6 mm outer diameters, respectively. The segmentation is shown in Figure 1.

Figure 1 Neurovascular parameters measured using OCT and OCTA
(a, b, c) Segmentation of pRNFL, GC-IPL, and VD and PD respectively as in the left eye. (d, e, f) The pRNFL thickness map, GC-IPL thickness map, and OCTA images of the left eye of a healthy individual. (g, h, i) The pRNFL thickness map, GC-IPL thickness map, and OCTA images of the left eye of a patient with CKD stage 5. Significantly thinner pRNFL and CG-IPL, as well as decreased vessel density can be observed in the CKD patient. S, superior; T, temporal; I, inferior; N, nasal; TS, temporal superior; TI, temporal inferior; NI, nasal inferior; NS, nasal superior; OS, outer superior; OT, outer temporal; OI, outer inferior; ON, outer nasal; IS, inner superior; IT, inner temporal; II, inner inferior; IN, inner nasal; C, central. CKD, chronic kidney disease; pRNFL, peripapillary retinal nerve fiber layer; GC-IPL, macular ganglion cell-inner plexiform layer; VD, vessel density; PD, perfusion density; OCT, optical coherence tomography; OCTA, optical coherence tomography angiography.

Statistical analysis

IBM SPSS Statistics Program V.26.0 (SPSS, Chicago, Illinois, USA) was used for data analysis. Mean  imputation was used for partly missing data. For patients with data from both eyes available, one eye was selected randomly to enter the final analyses. Data normality was accessed via the Kolmogorov-Smirnov test. Continuous variables were compared using the t test, Mann−Whitney U test, or Kruskal−Wallis test accordingly. Categorical variables were compared using Pearson's chi-square test. Multiple linear regression was employed to analyze  the correlations between retinal parameters and kidney function, and to compare neurovascular measurements between the HC and different CKD groups. Confounding factors including age, sex, smoking status, hypertension and cardiovascular diseases were adjusted using multiple linear regression when analyzing the CKD group, while age and sex were adjusted when comparing between healthy controls and the CKD group. To distinguish CKD  stages, logistic regression was utilized. The diagnostic efficacy was demonstrated by the receiver operating characteristics (ROC) curve and the area under the curve (AUC).[30] To evaluate the performance of logistic regression models, k-fold cross-validation (k=5) was performed with R 4.1.1 (R Core Team, 2021). A P < 0.05 was considered statistically significant across all analyses. Bonferroni correction was applied in multiple comparisons.

RESULTS

Demographic Data

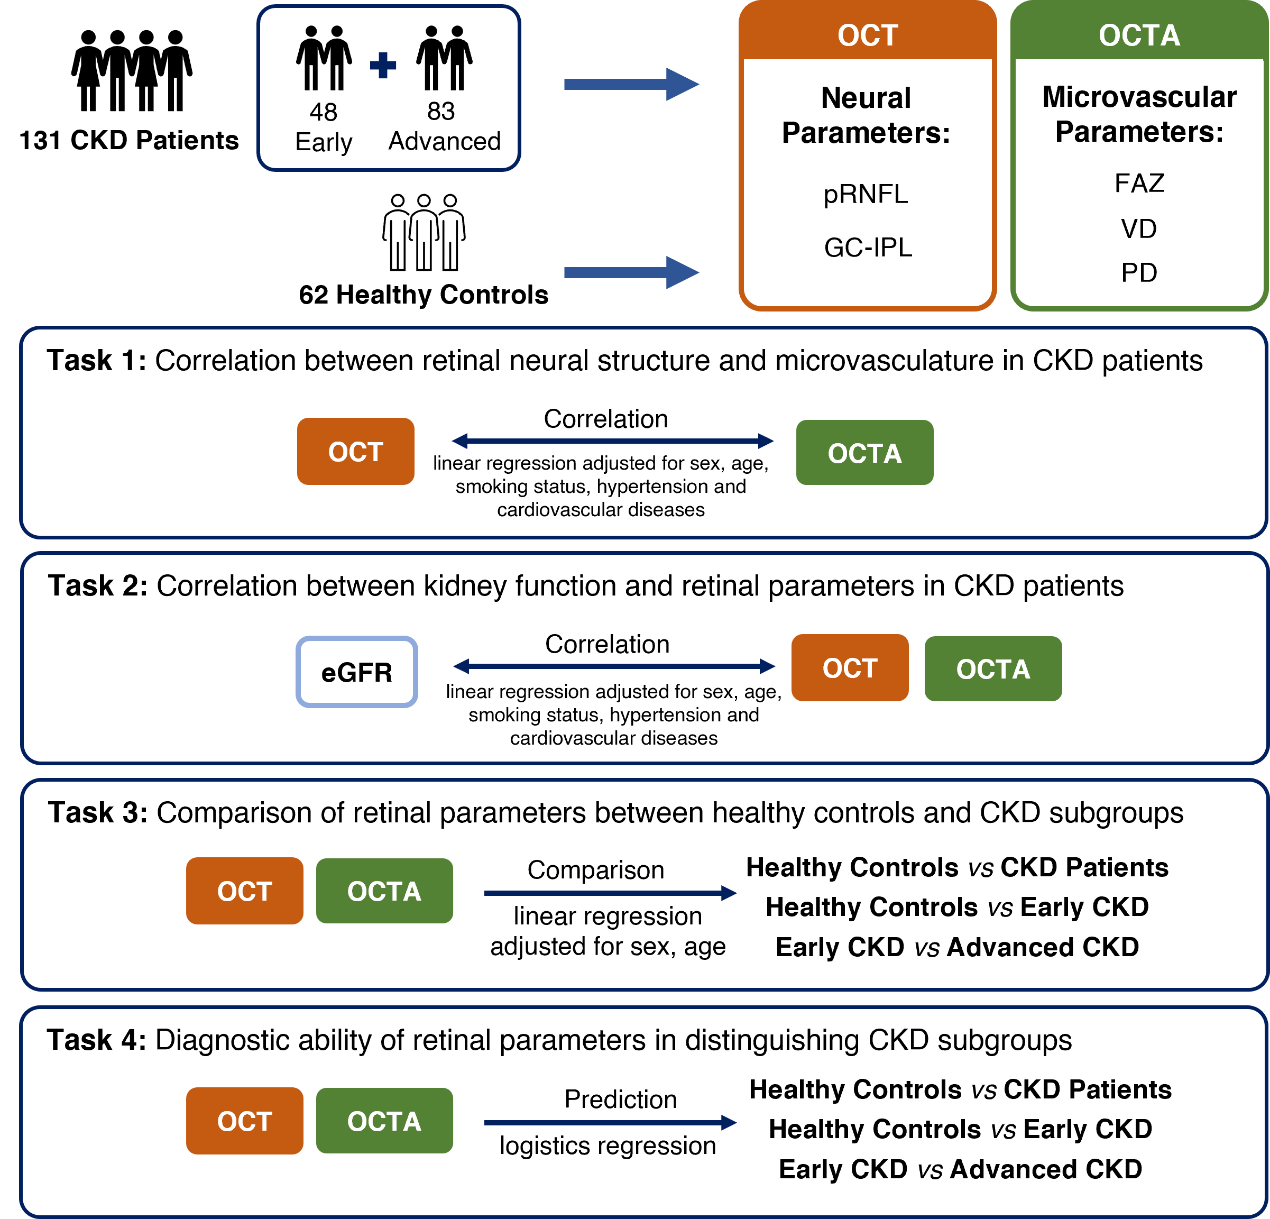
A total of 131 patients and 62 healthy controls were included in the data analysis. The CKD patients were further stratified into the early CKD group and advanced CKD group, comprising 48 and 83 patients, respectively. The average age of the patient group was 46.32 years, with 52.7% being men. The average age of the healthy control group was 42.15 years, with 43.5% being men. Additional demographic data are shown in Table 1. The causes of CKD are summarized in Supplementary Table S1. The overview of study participants, retinal parameters and primary outcomes is depicted in Figure 2.

Table 1 Demographic data of the CKD group and the healthy control group

Demographic data

Healthy Control

Early CKD

Advanced CKD

P value

Patients (n)

62

48

83


Age (year)

40.50 (25.25)

37.87 (19.80)

48.00 (20.00)

0.004

Male (%)

27 (43.5)

20 (41.7)

49 (59.0)

0.079

Serum Creatinine (µmol/L)

-

78.840 (24.229)

893.435 (353.338)

<0.001

eGFR (ml/min/1.73 m2 )

-

95.833 (19.407)

12.035 (13.925)

<0.001

Smoking (%)

-

1 (2.08)

11 (13.25)

0.132

Hypertension (%)

-

6 (12.50)

31 (37.35)

0.152

Cardiovascular Diseases (%)

-

1 (2.08)

5 (6.02)

0.299

Age was represented as median (IQR) and was analyzed using the Kruskal−Wallis test.Sex, smoking status, hypertension and cardiovascular diseases were represented as number (percentage) and analyzed by Pearson's chi-square test. BUN, serum creatinine, and eGFR were compared with the Mann−Whitney U test and are represented as the median (IQR). The bold values indicate statistically significant P values (P <0.05). CKD, chronic kidney disease; eGFR, estimated glomerular filtration rate; SD, standard deviation; IQR, interquartile range.

Table S1 Causes of CKD

Kidney Disease Diagnosis

n(%)

Glomerular Diseases

112 (85.5%)

Immunoglobulin A Nephropathy (IgAN)

21 (16.0%)

Membranous Nephropathy

8 (6.1%)

Minimal Change Disease

5 (3.8%)

Focal Segmental Glomerulosclerosis (FSGS)

3 (2.3%)

Infection-related Glomerulonephritis

2 (1.5%)

Membranoproliferative Glomerulonephritis

2 (1.5%)

Lupus Nephritis

3 (2.3%)

Unknown

68 (51.9%)

Obstructive Causes

9 (6.9%)

Unknown Causes

10 (7.6%)

The number of patients diagnosed with each disease is presented as n.


Figure 2 Overview of study participants, retinal parameters and primary outcomes
CKD, chronic kidney disease; OCT, optical coherence tomography; OCTA, optical coherence tomography angiography; pRNFL, peripapillary retinal nerve fiber layer; GC-IPL, macular ganglion cell-inner plexiform layer; FAZ, foveal avascular zone; VD, vessel density; PD, perfusion density; eGFR, estimated glomerular filtration rate. 

Retinal neural structure and microvasculature were correlated in CKD patients

The correlation between neural parameters and average VD and average PD is presented in Supplementary Table S2. Following adjustment for sex,
age, smoking status, hypertension and cardiovascular diseases using multiple linear regression, average pRNFL and the inferior sector of pRNFL exhibited a significant correlation with VD (average: β = 0.050 8, Padjusted = 0.033; inferior: β = 0.327, Padjusted = 0.019) and PD (average: β = 0.001 3, P = 0.042; inferior: β = 0.000 8, P = 0.025). Average GC-IPL thickness was positively correlated with VD (β = 0.090 2, Padjusted < 0.001) and PD (β = 0.002 4, Padjusted < 0.001). GC-IPL thickness in all other sectors were also found positively correlated  with VD and PD, with Padjusted lesser than 0.05 after Bonferroni correction.

Table S2 Correlation between average OCT and OCTA parameters in CKD patients

Quadrants

β (95% CI)

Padjusted

β (95% CI)

Padjusted

pRNFL (μm)


Average

0.0508 (0.0179, 0.0837)

0.033

0.0013 (0.0004, 0.0021)

0.042

Superior

0.0213 (0.0011, 0.0416)

0.464

0.0006 (3.78E-05, 0.0011)

0.429

Temporal

0.0352 (0.004, 0.0664)

0.331

0.0009 (4.63E-05, 0.0017)

0.461

Inferior

0.0327 (0.0127, 0.0526)

0.019

0.0008 (0.0003, 0.0013)

0.025

Nasal

0.0271 (-0.0112, 0.0654)

1.967

0.0007 (-0.0003, 0.0016)

2.320

GC-IPL (μm)


Average

0.0902 (0.0499, 0.1305)

< 0.001

0.0024 (0.0014, 0.0034)

< 0.001

Superior

0.0600 (0.0234, 0.0965)

0.018

0.0016 (0.0007, 0.0026)

0.010

Superior Temporal

0.0719 (0.0329, 0.1108)

0.005

0.0019 (0.0009, 0.0029)

0.002

Inferior temporal

0.0963 (0.0581, 0.1345)

< 0.001

0.0025 (0.0016, 0.0035)

< 0.001

Inferior

0.0690 (0.0347, 0.1032)

0.001

0.0019 (0.001, 0.0027)

0.001

Inferior nasal

0.0734 (0.0386, 0.1082)

0.001

0.0020 (0.0011, 0.0028)

< 0.001

Superior nasal

0.0631 (0.0267, 0.0994)

0.010

0.0017 (0.0008, 0.0026)

0.006

†Multiple linear regression with average VD.‡Multiple linear regression with average PD.A linear regression model was applied in all subjects. Sex, age, smoking status, hypertension and cardiovascular diseases were covariates entered into the model. The bold values indicate statistically significant after Bonferroni correction.

Retinal neurovascular parameters reflected kidney function deterioration

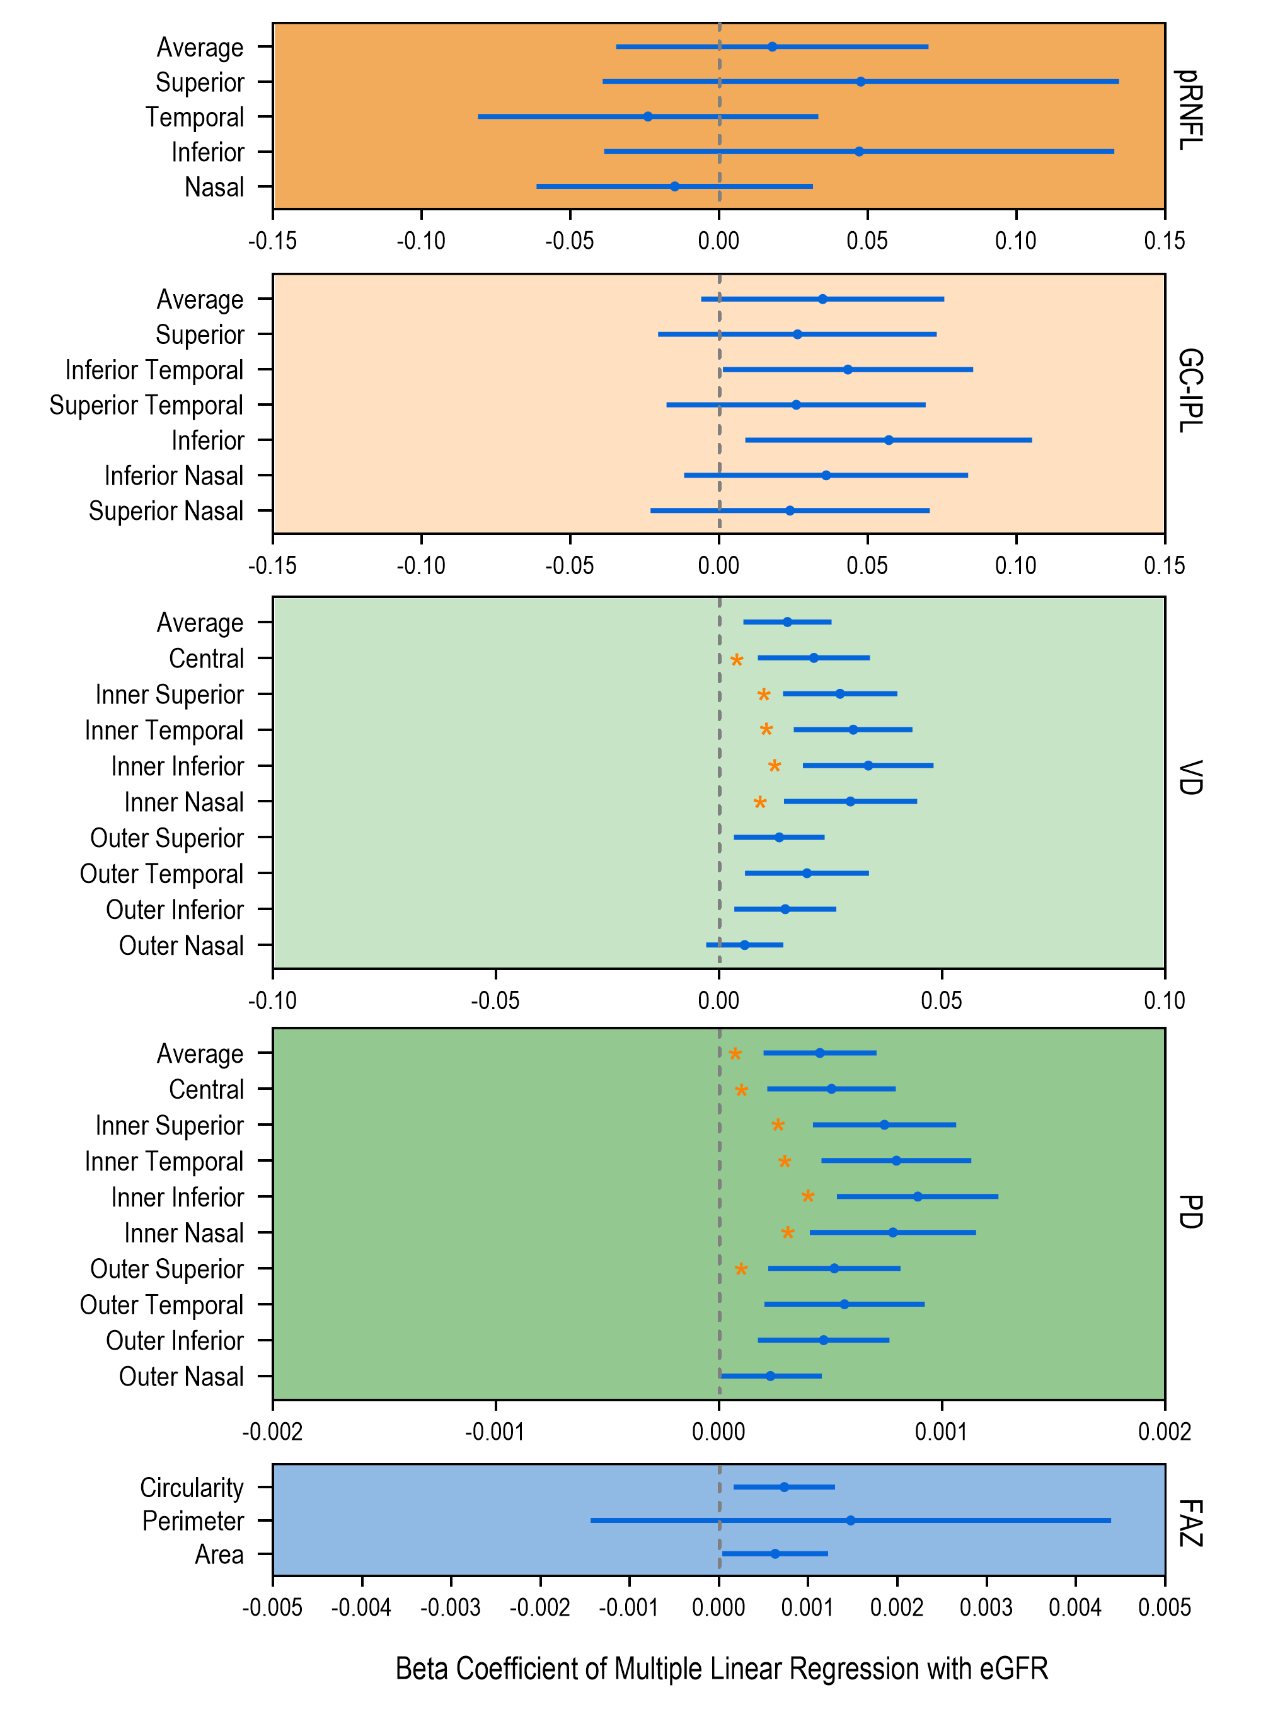
eGFR serves as a commonly utilized parameter for assessing kidney function in CKD patients.[31] As shown in Figure 3, there was no significant relationship between eGFR and retinal neural parameters after Bonferroni correction of P values. Regarding vascular parameters, eGFR was significantly correlated with central VD (β = 0.021 3, Padjusted = 0.036 5) and VD in all inner sectors with Padjusted < 0.01. Kidney function showed significant correlations with average PD (β = 0.000 5,  Padjusted = 0.020 3) and central PD (β = 0.000 5 , Padjusted = 0.025 4), as well as PD in all inner sections and the superior outer grid. FAZ area showed a nominal correlation with eGFR (β = 0.000 6, P = 0.037 1).

Figure 3 Correlation between eGFR and retinal neurovascular parameters in CKD patients
* Padjusted < 0.05; Multiple linear regression models were applied with each parameter. Sex, age, smoking status, hypertension and cardiovascular diseases were covariates in the models. eGFR, estimated glomerular filtration rate; pRNFL, peripapillary retinal nerve fiber layer; GC-IPL, macular ganglion cell-inner plexiform layer; VD, vessel density; PD, perfusion density; FAZ, foveal avascular zone.

Structural and angiographic parameters significantly decreased in CKD patients

The comparison of neurovascular measurements between the HC and different CKD groups was performed with multiple linear regression models to adjust for sex and age, as shown in Table 2 and Table 3. Among all OCT parameters, the average (β = –6.725, Padjusted < 0.001), temporal (β = –8.144, Padjusted < 0.001) and nasal pRNFL (β = –8.188, Padjusted < 0.001),  as well as GC-IPL in all sectors except for nasal superior showed a global decreasing trend with the presence of CKD. All VD and PD variables, and FAZ circularity (β = –0.078, Padjusted < 0.001) were found significantly decreased in CKD patients.

Table 2 Retinal neuralparameters compared between the healthy controls and the different CKD groups

Quadrants

Healthy Control (n=62)

CKD Group (n=131)

Early CKD
(n=48)

Advanced CKD (n=83)

β (95% CI)

β (95% CI)

β§ (95% CI)

pRNFL (μm)


Average

101.629 ± 8.950

94.413 ± 10.450

96.396 ± 9.385

93.307 ± 10.522

-6.725 (-9.782, -3.667)

-5.238 (-8.754, -1.722)

-2.226 (-6.117, 1.666)

Superior

127.758 ± 16.015

122.953 ± 17.605

126.438 ± 16.523

120.678 ± 17.521

-3.689 (-8.891, 1.513)

-1.369 (-7.549, 4.811)

-3.621 (-10.075, 2.833)

Temporal

76.774 ± 11.274

68.151 ± 11.205

68.417 ± 11.605

68.635 ± 11.208

-8.144 (-11.593, -4.694)

-8.371 (-12.741, -4.002)

0.561 (-3.706, 4.828)

Inferior

130.145 ± 17.615

122.142 ± 17.008

126.500 ± 13.781

119.682 ± 17.558

-7.545 (-12.837, -2.253)

-3.611 (-9.768, 2.546)

-6.336 (-12.647, -0.025)

Nasal

72.177 ± 12.599

64.024 ± 9.079

63.625 ± 10.332

64.023 ± 8.089

-8.188 (-11.378, -4.997)

-8.552 (-13.037, -4.068)

1.047 (-2.407, 4.501)

GC-IPL (μm)


Average

85.226 ± 5.308

80.312 ± 8.184

83.340 ± 5.490

78.347 ± 8.980

-4.542 (-6.805, -2.278)

-1.855 (-3.893, 0.183)

-4.028 (-7.017, -1.039)

Superior

85.919 ± 5.795

81.219 ± 9.360

84.123 ± 5.903

78.877 ± 11.381

-4.224 (-6.786, -1.662)

-1.789 (-4.032, 0.453)

-3.539 (-6.986, -0.092)

Temporal superior

83.419 ± 5.290

78.925 ± 8.647

81.349 ± 5.754

77.057 ± 10.244

-4.127 (-6.489, -1.765)

-2.031 (-4.083, 0.020)

-3.089 (-6.301, 0.124)

Temporal inferior

84.613 ± 5.475

79.876 ± 8.475

83.103 ± 5.617

77.867 ± 9.101

-4.454 (-6.800, -2.108)

-1.447 (-3.473, 0.580)

-4.461 (-7.543, -1.378)

Inferior

83.371 ± 5.611

77.322 ± 9.628

80.995 ± 5.742

75.589 ± 10.961

-5.847 (-8.49, -3.205)

-2.360 (-4.532, -0.188)

-5.614 (-9.142, -2.086)

Nasal inferior

86.29 ± 5.579

81.082 ± 9.583

84.297 ± 5.954

79.291 ± 10.584

-4.720 (-7.320, -2.120)

-1.964 (-4.134, 0.205)

-4.13 (-7.639, -0.62)

Nasal superior

87.871 ± 5.841

83.402 ± 9.391

86.275 ± 6.127

81.267 ± 10.615

-4.006 (-6.580, -1.432)

-1.565 (-3.829, 0.700)

-3.513 (-6.964, -0.062)


† Comparison between HC and all CKD. ‡ Comparison between HC and early CKD. §comparison between early and advanced CKD.
The retinal neural parameters were represented as mean ± SD. A linear regression model was applied to adjust for age and sex, and smoking status, hypertension, and cardiovascular diseases were also adjusted when comparing early and advanced CKD.The bold values indicate statistically significant after Bonferroni correction(Padjusted < 0.05). SD, standard deviation; CKD, chronic kidney disease; pRNFL, peripapillary retinal nerve fiber layer; GC-IPL, macular ganglion cell-inner plexiform layer; HC, healthy control.


Table 3 Retinal microvascularparameters compared between the healthy controls and the different CKD groups


Quadrants


Healthy Control (n=62)

CKD Group (n=131)

Early CKD
(n=48)

Advanced CKD (n=83)

β (95% CI)

β (95% CI)

β§ (95% CI)

Vessel density (mm-1)

Average

18.308 ± 0.840

16.007 ± 2.149

17.094 ± 1.262

15.285 ± 2.347

-2.107 (-2.648, -1.566)

-1.217 (-1.606, -0.828)

-1.670 (-2.600, -0.741)

Central

8.795 ± 2.415

6.036 ± 2.566

7.102 ± 2.251

5.351 ± 2.605

-2.659 (-3.433, -1.884)

-1.689 (-2.574, -0.804)

-1.422 (-2.141, -0.703)

Inner superior

18.423 ± 1.032

15.903 ± 2.802

17.542 ± 1.415

14.774 ± 3.066

-2.346 (-3.065, -1.627)

-0.878 (-1.341, -0.414)

-2.339 (-3.271, -1.408)

Inner temporal

18.253 ± 1.319

15.612 ± 2.884

17.325 ± 1.290

14.542 ± 3.084

-2.502 (-3.261, -1.743)

-0.928 (-1.427, -0.430)

-2.666 (-3.622, -1.709)

Inner inferior

18.248 ± 1.174

15.433 ± 3.185

17.250 ± 1.759

14.307 ± 3.361

-2.672 (-3.497, -1.847)

-0.999 (-1.555, -0.442)

-2.819 (-3.883, -1.755)

Inner nasal

18.226 ± 1.417

15.554 ± 3.160

17.277 ± 1.763

14.505 ± 3.352

-2.484 (-3.311, -1.657)

-0.950 (-1.553, -0.347)

-2.514 (-3.605, -1.424)

Outer superior

18.745 ± 0.738

16.483 ± 2.251

17.585 ± 1.166

15.733 ± 2.572

-2.012 (-2.558, -1.466)

-1.166 (-1.515, -0.816)

-1.280 (-2.024, -0.536)

Outer temporal

17.527 ± 1.492

14.971 ± 2.951

16.277 ± 1.847

14.182 ± 3.140

-2.329 (-3.101, -1.557)

-1.251 (-1.869, -0.633)

-1.742 (-2.763, -0.721)

Outer inferior

18.479 ± 1.030

16.173 ± 2.457

17.185 ± 1.571

15.534 ± 2.649

-2.107 (-2.735, -1.480)

-1.297 (-1.776, -0.817)

-1.314 (-2.155, -0.473)

Outer nasal

19.915 ± 0.743

18.563 ± 1.823

19.165 ± 1.202

18.092 ± 2.118

-1.163 (-1.615, -0.711)

-0.754 (-1.107, -0.400)

-0.611 (-1.251, 0.029)

Perfusion density (unitless)

Average

0.448 ± 0.021

0.386 ± 0.056

0.417 ± 0.032

0.367 ± 0.060

-0.057 (-0.071, -0.043)

-0.031 (-0.041, -0.021)

-0.039 (-0.060, -0.018)

Central

0.197 ± 0.056

0.131 ± 0.059

0.156 ± 0.052

0.116 ± 0.060

-0.063 (-0.081, -0.045)

-0.041 (-0.061, -0.020)

-0.041 (-0.059, -0.022)

Inner superior

0.441 ± 0.028

0.376 ± 0.071

0.419 ± 0.037

0.346 ± 0.076

-0.061 (-0.080, -0.043)

-0.022 (-0.034, -0.010)

-0.064 (-0.087, -0.041)

Inner temporal

0.430 ± 0.034

0.366 ± 0.073

0.410 ± 0.033

0.338 ± 0.078

-0.061 (-0.080, -0.042)

-0.020 (-0.033, -0.007)

-0.070 (-0.094, -0.046)

Inner inferior

0.434 ± 0.031

0.363 ± 0.080

0.411 ± 0.046

0.334 ± 0.083

-0.067 (-0.088, -0.047)

-0.024 (-0.038, -0.009)

-0.074 (-0.100, -0.048)

Inner nasal

0.428 ± 0.036

0.363 ± 0.079

0.406 ± 0.043

0.336 ± 0.084

-0.061 (-0.082, -0.041)

-0.022 (-0.037, -0.007)

-0.065 (-0.092, -0.037)

Outer superior

0.467 ± 0.020

0.407 ± 0.065

0.442 ± 0.049

0.384 ± 0.068

-0.054 (-0.070, -0.038)

-0.025 (-0.038, -0.012)

-0.046 (-0.067, -0.024)

Outer temporal

0.431 ± 0.040

0.362 ± 0.076

0.397 ± 0.051

0.340 ± 0.080

-0.064 (-0.084, -0.043)

-0.034 (-0.051, -0.017)

-0.048 (-0.074, -0.021)

Outer inferior

0.462 ± 0.027

0.395 ± 0.064

0.425 ± 0.042

0.377 ± 0.067

-0.062 (-0.078, -0.046)

-0.037 (-0.050, -0.024)

-0.041 (-0.063, -0.020)

Outer nasal

0.486 ± 0.019

0.449 ± 0.049

0.467 ± 0.030

0.436 ± 0.057

-0.032 (-0.044, -0.020)

-0.019 (-0.028, -0.010)

-0.020 (-0.037, -0.003)

Foveal avascular zone


Area (mm2)

0.297 ± 0.103

0.265 ± 0.125

0.305 ± 0.116

0.245 ± 0.124

-0.028 (-0.063, 0.008)

0.007 (-0.034, 0.049)

-0.055 (-0.099, -0.011)

Perimeter (mm)

2.209 ± 0.438

2.183 ± 0.594

2.292 ± 0.483

2.120 ± 0.644

-0.007 (-0.174, 0.159)

0.081 (-0.092, 0.254)

-0.13 (-0.346, 0.087)

Circularity

0.750 ± 0.075

0.668 ± 0.114

0.709 ± 0.942

0.644 ± 0.118

-0.078 (-0.110, -0.047)

-0.041 (-0.073, -0.008)

-0.065 (-0.106, -0.023)

† Comparison between HC and all CKD. ‡ Comparison between HC and early CKD. §comparison between early and advanced CKD.

The retinal vascular parameters were represented as mean ± SD. A linear regression model was applied to adjust for age and sex, and smoking status, hypertension, and cardiovascular diseases were also adjusted when comparing early and advanced CKD.The bold values indicate statistically significant after Bonferroni correction(P-adjusted< 0.05). CKD, chronic kidney disease; HC, healthy control.


When comparing early CKD with HC, temporal (β = –8.371, Padjusted = 0.009) and nasal pRNFL  thickness (β = –8.552, Padjusted = 0.009) were related with CKD. No significant correlation was found between GC-IPL parameters and early CKD. Decrease in VD of all but inner nasal sectors, and PD of all but inner temporal, inferior and nasal sectors were found to be ssociated with early CKD compared with HC.
Further comparison between early and advanced  CKD after adjusting for age, sex, smoking status, hypertension and cardiovascular diseases showed that no pRNFL parameters were associated with disease progression. Advanced CKD was correlated with decrease in all GC-IPL parameters, however the P values were insignificant after adjustment. On the other hand, average VD (β = –1.422, Padjusted = 0.005) and all sectors except outer inferior and outer nasal VD, along with average PD (β = –0.041, Padjusted = 0.000 8) and PD of all but outer nasal sectors decreased significantly as CKD progressed.

Diagnostic potential of retinal neurovascularparameters on CKD stages

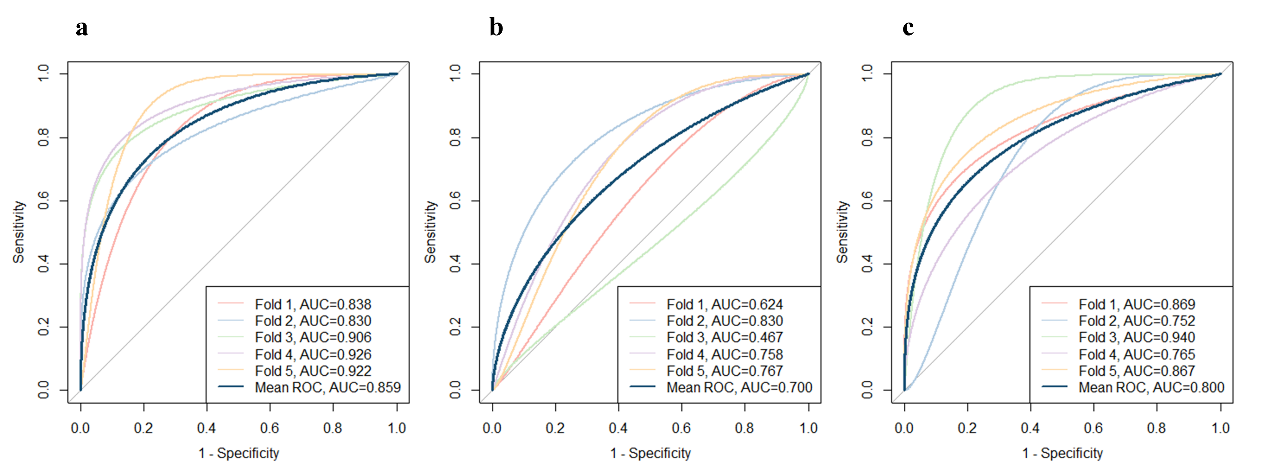
We applied logistic regression analysis to determine the diagnostic performance of the OCT and OCTA  results.[30] Parameters significantly associated with each intergroup statistical analyzes were selected to enter the logistic regression models. To distinguish CKD patients from HC, the model achieved a mean AUC of 0.853 (0.795 to 0.910). The model differentiating early CKD from HC achieved a mean AUC of 0.739 (0.643 to 0.834), and the model differentiating early and advanced CKD had a mean AUC of 0.800 (0.723 to 0.877). The mean accuracies of the three models were 78.7%, 70.0%, and 73.3%, respectively. The ROC curves are shown in Figure 4. The results of the ROC analysis are presented in Supplementary Table S3.

Figure 4 Diagnostic performance of retinal parameters represented by ROC curves
ROC curves showing the diagnostic value of retinal parameters in (a) distinguishing CKD from healthy controls; (b) distinguishing early CKD and healthy controls; (c) distinguishing advanced and early CKD. AUC, area under the curve; CKD, chronic kidney disease; ROC, receiver operating characteristic curve.

Table S3 Results of logistics regression

Models

HC vs. CKD

HC vs. Early CKD

Early CKD vs. Advanced CKD

Mean AUC (95% CI)

0.853 (0.795, 0.910)

0.739 (0.643, 0.834)

0.800 (0.723, 0.877)

Sensitivity

0.629

0.751

0.694

Specificity

0.859

0.613

0.776

Accuracy

0.787

0.700

0.733

Five-fold cross validation was applied to testify the models. The AUC of the ROC curves and accuracy were calculated for each fold and the mean value was then calculated.

DISCUSSION

The retina has been proven to be an easily accessible window for observing systemic diseases, such as cardiovascular diseases,[32] diabetes,[33] and CKD.[14] With the development of fast and non-invasive examination methods such as OCT and OCTA, quantitative analysis of retinal structure emerges as an innovative approach for monitoring microvasculature  changes in the retina. Consequently, it offers a novel avenue for accessing systemic pathologies. In this study, we identified correlations between kidney function and retinal neurovascular changes in nondiabetic CKD patients. Furthermore, we demonstrated the pattern of neurovascular deterioration in different stages of the disease as compared with healthy controls. Our results also proved the diagnostic value of OCT and OCTA parameters in distinguishing HC, early, and advanced CKD with logistic regression models. Overall, these results suggest that retinal neurovascular changes may reflect the occurrence and progression of nondiabetic CKD, underscoring the importance of retinal non-invasive examinations in CKD management.

Retinal neural and vascular parameters showed a significant positive correlation in nondiabetic CKD patients. The thinning of retinal GC-IPL was associated with the decrease of VD and PD in the superficial vascular plexus (SVP) microvasculature, which primarily aligns with the GC-IPL.[34] First discussed in reference to the central nervous system, the term "neurovascular unit" was coined to describe the interrelationship of neuronal,  glial, and vascular cells, which together regulate neuronal activities[35] and microvascular permeability.[36] The retina as a component of the central nervous system also shares similar traits. The dysfunction of either neural or vascular components could cause disturbance in the physiology of the retina, and neurovascular unit defects were reported to contribute to the pathology of diabetic retinopathy.[37-38] Our results showed that similar alterations could be present in nondiabetic CKD patients, implying that the retinal pathologies in CKD patients could be a common consequence of neurovascular dysfunction.

The eGFR, calculated using the CKD-EPI equation, is widely accepted as a credible biomarker of kidney function.[28] Our study revealed a significant relationship between kidney function and retinal manifestations after adjustment for sex and age. Despite having a limited correlation with neural parameters, eGFR was significantly associated with the inner sections of VD and PD, which cover the foveal and parafoveal regions.[39] This result is consistent with previous studies focusing on diabetic CKD patients.[21] However, VD and PD of the outer sections and the FAZ parameters showed no significant correlation with kidney function after adjustment for multiple comparisons. This result indicated that retinal microvascular conditions in the foveal and parafoveal areas could serve as a better indicator of kidney dysfunction than neural parameters in nondiabetic CKD patients.

When comparing HC and different CKD stages, our findings revealed distinct patterns of retinal neurovascular defects in patients of different stages. OCT results revealed a collective decrease in pRNFL and GC-IPL thickness in CKD patients, with the thinning of pRNFL marked the onset and the thinning of GC-IPL indicated disease aggravation. Prior studies showed a higher prevalence of various optic neuropathies in CKD patients,[40] namely uremic optic neuropathy, ischemic optic neuropathy, and complications associated with drug use or infections,[41] which could contribute to defects in the neural structure of the retina. As the thinning of the pRNFL and the GC-IPL reflects axon loss and neuron loss of the retinal ganglion cells respectively,[42] it could be deduced that axonal changes are antecedent in the course of CKD. Moreover, the decrease in pRNFL thickness was only significant in the temporal and nasal sectors. We hypothesize that this phenomenon may be associated with the anatomical features of the parapapillary area, as the temporal and nasal sectors are characterized by relatively sparse capillaries in healthy subjects.[43] Consequently, due to the absence of reserve capacity, these quadrants may be more susceptible to vascular pathologies in CKD, leading to the specific pattern of pRNFL thinning observed in the early stages of the disease.

A significant reduction in VD and PD of the SVP was also observed in CKD patients. The SVP is directly connected to the central retinal artery and supplies all other retinal vascular plexuses through vertical anastomoses;[44] therefore, its condition could faithfully reflect the retinal microcirculation.[34] Yeung et al.[20] previously found that VD in the parafoveal SVP was significantly decreased in CKD patients in comparison with healthy control subjects. Similarly, Wang et al.[21] studied type 2 diabetes mellitus (T2DM) patients and discovered a reduced VD in subjects with CKD. In line with previous studies, our study showed a decrease in retinal vascular density in nondiabetic CKD patients, indicating that vascular function deterioration is independent of diabetic status and could be present in CKD of other causes. Endothelin-1 was identified as a predictor of vascular dysfunction in CKD,[45] which could present as sparse capillaries, reduction in branching,  and an increase in tortuosity.[46] Although the role of endothelin in diabetic CKD has been well-established, recent research has also unveiled a significant correlation between endothelin and the pathogenesis of nondiabetic CKD,[47-49] hinting at the possible mechanism of retinal microvascular deterioration in the absence of diabetes. Additionally, the decline in VD and PD in the perifoveal region preceded that of the parafoveal sections. We hypothesize that the parafoveal microcirculation is reserved in the early stages of CKD for it is crucial to satisfy foveal metabolic and functional needs.[39]
Interestingly, nondiabetic CKD patients did not show significant increase in FAZ area, which is a widely proven characteristic of diabetic patients[44,50-51] and was also found presence in CKD patients.[52] On the other hand, nondiabetic CKD patients showed decreased FAZ circularity compared with HC, a characteristic consistent with diabetic patients[24,53] and CKD patients of undefined causes.[20] These results indicated that FAZ enlargement previously found in CKD patients could be caused by diabetes instead of primary kidney dysfunction, and that FAZ acircularity could be a more sensitive marker to reflect CKD pathologies in the retina.

Based on the statistical results, we further examined the capacity of OCT and OCTA parameters to diagnose and stratify nondiabetic CKD through logistic regression models. Our results showed that retinal neurovascular parameters could reach an AUC of 0.853 in distinguishing CKD from HC, and reach an AUC of 0.800 in stratifying CKD patients. We believe that this is the first work to show the clinical diagnostic competency of retinal neurovascular characteristics obtained by OCT and OCTA in nondiabetic CKD patients. Considering these discoveries, we suggest that OCTA parameters could serve as valuable biomarkers in CKD screening and diagnosis.
There are several limitations in the present study. The primary constraint is the cross-sectional nature of the data. We did not clarify the chronological order of retinal neurovascular alterations and kidney damage in our study, thus lacking sufficient evidence to pinpoint the causal relationship between vascular injuries and kidney dysfunction. It is imperative to recruit a larger prospective cohort in future studies to collect longitudinal data and analyse the predictive value of retinal parameters in CKD patients. Secondly, the relatively small sample size also constrained the generalization of our results. Future study should include more diverse participants to testify the validity of our conclusions in different populations. Lastly, given the complex etiology of nondiabetic CKD, it is desirable to expand the sample size and conduct further subgroup analyses targeting different primary kidney diseases in the future.

In summary, this research discovered distinct retinal neurovascular alterations in nondiabetic CKD patients assessed by OCT and OCTA. Retinal parameters exhibited significant correlations with kidney function, and deterioration of the retinal neurovascular structure was evident in both early and advanced CKD patients. In addition, the selected OCT and OCTA parameters were valuable in distinguishing CKD patients from healthy controls and in stratifying early and advanced patients.
Our research addresses a gap in the current literature regarding retinal pathology in nondiabetic CKD patients. Additionally, our findings highlight the credibility of OCT and OCTA as non-invasive methods for screening and longitudinally managing nondiabetic CKD in both clinical and research settings.

Correction notice

None

Acknowledgement

We thank Mr. Yaowu Huang (Carl Zeiss Meditec AG, China) and Mr. Sijian Zhang (Carl Zeiss Meditec AG, China) for helping with the technical service of the high-definition OCT and AngioPlex device. This project is supported by Hainan Province Clinical Medical Center.

Author Contributions

(Ⅰ) Conception and design: Hui Peng, Haotian Lin
(Ⅱ) Administrative support: Zengchun Ye, Dong Liu, Duoru Lin, Hui Xiao
(Ⅲ) Provision of study materials or patients: Xiayin Zhang, Zengchun Ye, Hui Peng Haotian Lin
(Ⅳ) Collection and assembly of data: Wai Cheng Iao, Xiayin Zhang, Xia Chen, Qian Wang, Huiqun Li, Yanru Chen, Tong Han, Zengchun Ye, Hui Peng
(Ⅴ) Data analysis and interpretation: Wai Cheng Iao, Lanqin Zhao, Jingyi Wen, Qianni Wu
(Ⅵ) Manuscript writing: All authors
(Ⅶ) Final approval of manuscript: All authors

Funding

This work is supported by the National Natural Science Foundation of China (92368205), the National Natural Science Foundation of China (82171035), the High-level Science and Technology Journals Projects of Guangdong Province (2021B1212010003), the Science and Technology Planning Project of Guangdong Province (2023A1111120011), the Science and Technology Planning Project of Guangzhou City (2024B03J1233), the Science and Technology Planning Projects of Guangdong Province (2021B1111610006), and the Basic Scientific Research Projects of Sun Yat-sen University (23ykcxqt002), China Chronic Kidney Disease Management Innovation Program (202206080010), the National Natural Science Foundation of China (82170762), the National Natural Science Foundation of Guangdong, China (2022A1515012637), “Three big” Construction of Large Science Program of Sun Yat-sen University, China (82000-18843406).

Conflict of Interests

None of the authors has any conflicts of interest to disclose. All authors have declared in the completed the ICMJE uniform disclosure form.

Patient consent for publication

Written informed consent was obtained from all participants.

Ethical Statement

The study was approved by the Ethics Committee of the Third Affiliated Hospital of Sun Yat-sen University and Zhongshan Ophthalmic Center, Sun Yat-sen University(2019KYPJ163). It was conducted in accordance with the tenets of the Declaration of Helsinki. Written informed consent was obtained from all participants.

Provenance and Peer Review

This article was a standard submission to our journal. The article has undergone peer review with our anonymous review system.

Data Sharing Statement

None

Open Access Statement

This is an Open Access article distributed in accordance with the Creative Commons Attribution-NonCommercial-NoDerivs 4.0 International License (CC BY-NC-ND 4.0), which permits the non-commercial replication and distribution of the article with the strict proviso that no changes or edits are made and the original work is properly cited (including links to both the formal publication through the relevant DOI and the license).


1、Hill NR, Fatoba ST, Oke JL, et al. Global prevalence of chronic kidney disease - A systematic review and meta-analysis. PLoS One. 2016, 11(7): e0158765. DOI: 10.1371/journal.pone.0158765.Hill NR, Fatoba ST, Oke JL, et al. Global prevalence of chronic kidney disease - A systematic review and meta-analysis. PLoS One. 2016, 11(7): e0158765. DOI: 10.1371/journal.pone.0158765.
2、Glassock RJ, Warnock DG, Delanaye P. The global burden of chronic kidney disease: estimates, variability and pitfalls. Nat Rev Nephrol. 2017, 13(2): 104-114. DOI: 10.1038/nrneph.2016.163.Glassock RJ, Warnock DG, Delanaye P. The global burden of chronic kidney disease: estimates, variability and pitfalls. Nat Rev Nephrol. 2017, 13(2): 104-114. DOI: 10.1038/nrneph.2016.163.
3、Mills KT, Xu Y, Zhang W, et al. A systematic analysis of worldwide population-based data on the global burden of chronic kidney disease in 2010. Kidney Int. 2015, 88(5): 950-957. DOI: 10.1038/ki.2015.230.Mills KT, Xu Y, Zhang W, et al. A systematic analysis of worldwide population-based data on the global burden of chronic kidney disease in 2010. Kidney Int. 2015, 88(5): 950-957. DOI: 10.1038/ki.2015.230.
4、Bikbov B, Perico N, Remuzzi G, et al. Disparities in chronic kidney disease prevalence among males and females in 195 countries: analysis of the global burden of disease 2016 study. Nephron. 2018, 139(4): 313-318. DOI: 10.1159/000489897Bikbov B, Perico N, Remuzzi G, et al. Disparities in chronic kidney disease prevalence among males and females in 195 countries: analysis of the global burden of disease 2016 study. Nephron. 2018, 139(4): 313-318. DOI: 10.1159/000489897
5、Querfeld U, Mak RH, Pries AR. Microvascular disease in chronic kidney disease: the base of the iceberg in cardiovascular comorbidity. Clin Sci. 2020, 134(12): 1333- 1356. DOI: 10.1042/CS20200279.Querfeld U, Mak RH, Pries AR. Microvascular disease in chronic kidney disease: the base of the iceberg in cardiovascular comorbidity. Clin Sci. 2020, 134(12): 1333- 1356. DOI: 10.1042/CS20200279.
6、Jankowski J, Floege J, Fliser D, et al. Cardiovascular disease in chronic kidney disease: pathophysiological insights and therapeutic options. Circulation. 2021, 143(11): 1157-1172. DOI: 10.1161/CIRCULATIONAHA. 120.050686.Jankowski J, Floege J, Fliser D, et al. Cardiovascular disease in chronic kidney disease: pathophysiological insights and therapeutic options. Circulation. 2021, 143(11): 1157-1172. DOI: 10.1161/CIRCULATIONAHA. 120.050686.
7、Bello AK, Alrukhaimi M, Ashuntantang GE, et al. Complications of chronic kidney disease: current state, knowledge gaps, and strategy for action. Kidney Int Suppl. 2017, 7(2): 122-129. DOI: 10.1016/j.kisu.2017.07.007.Bello AK, Alrukhaimi M, Ashuntantang GE, et al. Complications of chronic kidney disease: current state, knowledge gaps, and strategy for action. Kidney Int Suppl. 2017, 7(2): 122-129. DOI: 10.1016/j.kisu.2017.07.007.
8、Viggiano D, Wagner CA, Martino G, et al. Mechanisms of cognitive dysfunction in CKD. Nat Rev Nephrol. 2020, 16(8): 452-469. DOI: 10.1038/s41581-020-0266-9.Viggiano D, Wagner CA, Martino G, et al. Mechanisms of cognitive dysfunction in CKD. Nat Rev Nephrol. 2020, 16(8): 452-469. DOI: 10.1038/s41581-020-0266-9.
9、Hamed SA. Neurologic conditions and disorders of uremic syndrome of chronic kidney disease: presentations, causes, and treatment strategies. Expert Rev Clin Pharmacol. 2019, 12(1): 61-90. DOI: 10.1080/17512433.2019.1555468.Hamed SA. Neurologic conditions and disorders of uremic syndrome of chronic kidney disease: presentations, causes, and treatment strategies. Expert Rev Clin Pharmacol. 2019, 12(1): 61-90. DOI: 10.1080/17512433.2019.1555468.
10、Chang J, Ko A, Park SM, et al. Association of Cardiovascular Mortality and Deep Learning-Funduscopic Atherosclerosis Score derived from retinal fundus images. Am J Ophthalmol. 2020, 217: 121-130. DOI: 10.1016/j.ajo.2020.03.027.Chang J, Ko A, Park SM, et al. Association of Cardiovascular Mortality and Deep Learning-Funduscopic Atherosclerosis Score derived from retinal fundus images. Am J Ophthalmol. 2020, 217: 121-130. DOI: 10.1016/j.ajo.2020.03.027.
11、Cheung CYL, Ikram MK, Chen C, et al. Imaging retina to study dementia and stroke. Prog Retin Eye Res. 2017, 57: 89-107. DOI: 10.1016/j.preteyeres.2017.01.001.Cheung CYL, Ikram MK, Chen C, et al. Imaging retina to study dementia and stroke. Prog Retin Eye Res. 2017, 57: 89-107. DOI: 10.1016/j.preteyeres.2017.01.001.
12、Xiao W, Huang X, Wang JH, et al. Screening and identifying hepatobiliary diseases through deep learning using ocular images: a prospective, multicentre study. Lancet Digit Health. 2021, 3(2): e88-e97. DOI: 10.1016/ S2589-7500(20)30288-0Xiao W, Huang X, Wang JH, et al. Screening and identifying hepatobiliary diseases through deep learning using ocular images: a prospective, multicentre study. Lancet Digit Health. 2021, 3(2): e88-e97. DOI: 10.1016/ S2589-7500(20)30288-0
13、Wong CW, Wong TY, Cheng CY, et al. Kidney and eye diseases: common risk factors, etiological mechanisms, and pathways. Kidney Int. 2014, 85(6): 1290-1302. DOI: 10.1038/ki.2013.491.Wong CW, Wong TY, Cheng CY, et al. Kidney and eye diseases: common risk factors, etiological mechanisms, and pathways. Kidney Int. 2014, 85(6): 1290-1302. DOI: 10.1038/ki.2013.491.
14、Zhang K, Liu X, Xu J, et al. Deep-learning models for the detection and incidence prediction of chronic kidney disease and type 2 diabetes from retinal fundus images. Nat Biomed Eng. 2021, 5(6): 533-545. DOI: 10.1038/ s41551-021-00745-6.Zhang K, Liu X, Xu J, et al. Deep-learning models for the detection and incidence prediction of chronic kidney disease and type 2 diabetes from retinal fundus images. Nat Biomed Eng. 2021, 5(6): 533-545. DOI: 10.1038/ s41551-021-00745-6.
15、Huang D, Swanson EA, Lin CP, et al. Optical coherence tomography. Science. 1991, 254(5035): 1178-1181. DOI: 10.1126/science.1957169.Huang D, Swanson EA, Lin CP, et al. Optical coherence tomography. Science. 1991, 254(5035): 1178-1181. DOI: 10.1126/science.1957169.
16、Spaide RF, Fujimoto JG, Waheed NK, et al. Optical coherence tomography angiography. Prog Retin Eye Res. 2018, 64: 1-55. DOI: 10.1016/j.preteyeres.2017.11.003.Spaide RF, Fujimoto JG, Waheed NK, et al. Optical coherence tomography angiography. Prog Retin Eye Res. 2018, 64: 1-55. DOI: 10.1016/j.preteyeres.2017.11.003.
17、Zeng Y, Cao D, Yu H, et al. Early retinal neurovascular impairment in patients with diabetes without clinically detectable retinopathy. Br J Ophthalmol. 2019, 103(12): 1747-1752. DOI: 10.1136/bjophthalmol-2018-313582.Zeng Y, Cao D, Yu H, et al. Early retinal neurovascular impairment in patients with diabetes without clinically detectable retinopathy. Br J Ophthalmol. 2019, 103(12): 1747-1752. DOI: 10.1136/bjophthalmol-2018-313582.
18、Gong X, Wang W, Li W, et al. Association between renal function and retinal neurodegeneration in Chinese patients with type 2 diabetes mellitus. Ann Transl Med. 2021, 9(7): 560. DOI: 10.21037/atm-20-6957.Gong X, Wang W, Li W, et al. Association between renal function and retinal neurodegeneration in Chinese patients with type 2 diabetes mellitus. Ann Transl Med. 2021, 9(7): 560. DOI: 10.21037/atm-20-6957.
19、Zhuang X, Cao D, Zeng Y, et al. Associations between retinal microvasculature/microstructure and renal function in type 2 diabetes patients with early chronic kidney disease. Diabetes Res Clin Pract. 2020, 168: 108373. DOI: 10.1016/j.diabres.2020.108373.Zhuang X, Cao D, Zeng Y, et al. Associations between retinal microvasculature/microstructure and renal function in type 2 diabetes patients with early chronic kidney disease. Diabetes Res Clin Pract. 2020, 168: 108373. DOI: 10.1016/j.diabres.2020.108373.
20、Yeung L, Wu IW, Sun CC, et al. Early retinal microvascular abnormalities in patients with chronic kidney disease. Microcirculation. 2019, 26(7): e12555. DOI: 10.1111/micc.12555.Yeung L, Wu IW, Sun CC, et al. Early retinal microvascular abnormalities in patients with chronic kidney disease. Microcirculation. 2019, 26(7): e12555. DOI: 10.1111/micc.12555.
21、Wang W, He M, Gong X, et al. Association of r e n a l f u n c t i o n w i t h r e t i n a l v e s s e l d e n s i t y i n patients with type 2 diabetes by using swept-source optical coherence tomographic angiography. Br J Ophthalmol. 2020, 104(12): 1768-1773. DOI: 10.1136/ bjophthalmol-2019-315450.Wang W, He M, Gong X, et al. Association of r e n a l f u n c t i o n w i t h r e t i n a l v e s s e l d e n s i t y i n patients with type 2 diabetes by using swept-source optical coherence tomographic angiography. Br J Ophthalmol. 2020, 104(12): 1768-1773. DOI: 10.1136/ bjophthalmol-2019-315450.
22、Strain WD, Paldánius PM. Diabetes, cardiovascular disease and the microcirculation. Cardiovasc Diabetol. 2018, 17(1): 57. DOI: 10.1186/s12933-018-0703-2.Strain WD, Paldánius PM. Diabetes, cardiovascular disease and the microcirculation. Cardiovasc Diabetol. 2018, 17(1): 57. DOI: 10.1186/s12933-018-0703-2.
23、Zhang B, Chou Y, Zhao X, et al. Early detection of microvascular impairments with optical coherence tomography angiography in diabetic patients without clinical retinopathy: a meta-analysis. Am J Ophthalmol. 2021, 222: 226-237. DOI: 10.1016/j.ajo.2020.09.032.Zhang B, Chou Y, Zhao X, et al. Early detection of microvascular impairments with optical coherence tomography angiography in diabetic patients without clinical retinopathy: a meta-analysis. Am J Ophthalmol. 2021, 222: 226-237. DOI: 10.1016/j.ajo.2020.09.032.
24、Liu L, Gao J, Bao W, et al. Analysis of foveal microvascular abnormalities in diabetic retinopathy using optical coherence tomography angiography with projection artifact removal. J Ophthalmol. 2018, 2018: 3926745. DOI: 10.1155/2018/3926745.Liu L, Gao J, Bao W, et al. Analysis of foveal microvascular abnormalities in diabetic retinopathy using optical coherence tomography angiography with projection artifact removal. J Ophthalmol. 2018, 2018: 3926745. DOI: 10.1155/2018/3926745.
25、Manns L, Scott-Douglas N, Tonelli M, et al. A population-based analysis of quality indicators in CKD. Clin J Am Soc Nephrol. 2017,12(5):727-733. DOI:10.2215/ CJN.08720816.Manns L, Scott-Douglas N, Tonelli M, et al. A population-based analysis of quality indicators in CKD. Clin J Am Soc Nephrol. 2017,12(5):727-733. DOI:10.2215/ CJN.08720816.
26、Weckmann GFC, Stracke S, Haase A, et al. Diagnosis and management of non-dialysis chronic kidney disease in ambulatory care: a systematic review of clinical practice guidelines. BMC Nephrol. 2018, 19(1): 258. DOI: 10.1186/s12882-018-1048-5.Weckmann GFC, Stracke S, Haase A, et al. Diagnosis and management of non-dialysis chronic kidney disease in ambulatory care: a systematic review of clinical practice guidelines. BMC Nephrol. 2018, 19(1): 258. DOI: 10.1186/s12882-018-1048-5.
27、Anno. Chapter 1: definition and classification of CKD. Kidney Int Suppl. 2013, 3(1): 19-62. DOI: 10.1038/ kisup.2012.64.Anno. Chapter 1: definition and classification of CKD. Kidney Int Suppl. 2013, 3(1): 19-62. DOI: 10.1038/ kisup.2012.64.
28、Levey AS, Stevens LA, Schmid CH, et al. A new equation to estimate glomerular filtration rate. Ann Intern Med. 2009,150(9):604-612. DOI:10.7326/0003-4819-150-9- 200905050-00006.Levey AS, Stevens LA, Schmid CH, et al. A new equation to estimate glomerular filtration rate. Ann Intern Med. 2009,150(9):604-612. DOI:10.7326/0003-4819-150-9- 200905050-00006.
29、Wouters OJ, O’Donoghue DJ, Ritchie J, et al. Early chronic kidney disease: diagnosis, management and models of care. Nat Rev Nephrol. 2015, 11(8): 491-502. DOI: 10.1038/nrneph.2015.85.Wouters OJ, O’Donoghue DJ, Ritchie J, et al. Early chronic kidney disease: diagnosis, management and models of care. Nat Rev Nephrol. 2015, 11(8): 491-502. DOI: 10.1038/nrneph.2015.85.
30、Mandrekar JN. Receiver operating characteristic curve in diagnostic test assessment. J Thorac Oncol. 2010, 5(9): 1315-1316. DOI: 10.1097/JTO.0b013e3181ec173d.Mandrekar JN. Receiver operating characteristic curve in diagnostic test assessment. J Thorac Oncol. 2010, 5(9): 1315-1316. DOI: 10.1097/JTO.0b013e3181ec173d.
31、Consortium CKDP, Matsushita K, van der Velde M, et al. Association of estimated glomerular filtration rate and albuminuria with all-cause and cardiovascular mortality in general population cohorts: a collaborative meta-analysis. Lancet. 2010, 375(9731): 2073-2081. DOI: 10.1016/ S0140-6736(10)60674-5.Consortium CKDP, Matsushita K, van der Velde M, et al. Association of estimated glomerular filtration rate and albuminuria with all-cause and cardiovascular mortality in general population cohorts: a collaborative meta-analysis. Lancet. 2010, 375(9731): 2073-2081. DOI: 10.1016/ S0140-6736(10)60674-5.
32、Monteiro-Henriques I, Rocha-Sousa A, Barbosa-Breda J. Optical coherence tomography angiography changes in cardiovascular systemic diseases and risk factors: a Review. Acta Ophthalmol. 2022, 100(1): e1-e15. DOI: 10.1111/aos.14851.Monteiro-Henriques I, Rocha-Sousa A, Barbosa-Breda J. Optical coherence tomography angiography changes in cardiovascular systemic diseases and risk factors: a Review. Acta Ophthalmol. 2022, 100(1): e1-e15. DOI: 10.1111/aos.14851.
33、Islam MT, Al-Absi HRH, Ruagh EA, et al. DiaNet: a deep learning based architecture to diagnose diabetes using retinal images only. IEEE Access. 2021, 9: 15686-15695. DOI: 10.1109/ACCESS.2021.3052477.Islam MT, Al-Absi HRH, Ruagh EA, et al. DiaNet: a deep learning based architecture to diagnose diabetes using retinal images only. IEEE Access. 2021, 9: 15686-15695. DOI: 10.1109/ACCESS.2021.3052477.
34、Campbell JP, Zhang M, Hwang TS, et al. Detailed vascular anatomy of the human retina by projection-resolved optical coherence tomography angiography. Sci Rep. 2017, 7:42201. DOI: 10.1038/srep42201.Campbell JP, Zhang M, Hwang TS, et al. Detailed vascular anatomy of the human retina by projection-resolved optical coherence tomography angiography. Sci Rep. 2017, 7:42201. DOI: 10.1038/srep42201.
35、Nian S, Lo ACY, Mi Y, et al. Neurovascular unit in diabetic retinopathy: pathophysiological roles and potential therapeutical targets. Eye Vis. 2021, 8(1): 15. DOI: 10.1186/s40662-021-00239-1.Nian S, Lo ACY, Mi Y, et al. Neurovascular unit in diabetic retinopathy: pathophysiological roles and potential therapeutical targets. Eye Vis. 2021, 8(1): 15. DOI: 10.1186/s40662-021-00239-1.
36、Hawkins BT, Davis TP. The blood-brain barrier/ neurovascular unit in health and disease. Pharmacol Rev. 2005, 57(2): 173-185. DOI: 10.1124/pr.57.2.4.Hawkins BT, Davis TP. The blood-brain barrier/ neurovascular unit in health and disease. Pharmacol Rev. 2005, 57(2): 173-185. DOI: 10.1124/pr.57.2.4.
37、Antonetti DA, Klein R, Gardner TW. Diabetic retinopathy. N Engl J Med. 2012, 366(13): 1227-1239. DOI: 10.1056/ NEJMra1005073.Antonetti DA, Klein R, Gardner TW. Diabetic retinopathy. N Engl J Med. 2012, 366(13): 1227-1239. DOI: 10.1056/ NEJMra1005073.
38、Tham YC, Cheng CY, Zheng Y, et al. Relationship between retinal vascular geometry with retinal nerve fiber layer and ganglion cell-inner plexiform layer in nonglaucomatous eyes. Invest Ophthalmol Vis Sci. 2013, 54(12): 7309-7316. DOI: 10.1167/iovs.13-12796.Tham YC, Cheng CY, Zheng Y, et al. Relationship between retinal vascular geometry with retinal nerve fiber layer and ganglion cell-inner plexiform layer in nonglaucomatous eyes. Invest Ophthalmol Vis Sci. 2013, 54(12): 7309-7316. DOI: 10.1167/iovs.13-12796.
39、Yu DY, Cringle SJ, Yu PK, et al. Retinal capillary perfusion: spatial and temporal heterogeneity. Prog Retin Eye Res. 2019, 70: 23-54. DOI: 10.1016/ j.preteyeres.2019.01.001.Yu DY, Cringle SJ, Yu PK, et al. Retinal capillary perfusion: spatial and temporal heterogeneity. Prog Retin Eye Res. 2019, 70: 23-54. DOI: 10.1016/ j.preteyeres.2019.01.001.
40、Nusinovici S, Sabanayagam C, Teo BW, et al. Vision impairment in CKD patients: epidemiology, mechanisms, differential diagnoses, and prevention. Am J Kidney Dis. 2019, 73(6): 846-857. DOI: 10.1053/j.ajkd.2018.12.047Nusinovici S, Sabanayagam C, Teo BW, et al. Vision impairment in CKD patients: epidemiology, mechanisms, differential diagnoses, and prevention. Am J Kidney Dis. 2019, 73(6): 846-857. DOI: 10.1053/j.ajkd.2018.12.047
41、Winkelmayer WC, Eigner M, Berger O, et al. Optic neuropathy in uremia: an interdisciplinary emergency. Am J Kidney Dis. 2001, 37(3): E23. DOI: 10.1053/ ajkd.2001.22101.Winkelmayer WC, Eigner M, Berger O, et al. Optic neuropathy in uremia: an interdisciplinary emergency. Am J Kidney Dis. 2001, 37(3): E23. DOI: 10.1053/ ajkd.2001.22101.
42、Lamirel C, Newman N, Biousse V. The use of optical coherence tomography in neurology. Rev Neurol Dis. 2009, 6(4): E105-E120.Lamirel C, Newman N, Biousse V. The use of optical coherence tomography in neurology. Rev Neurol Dis. 2009, 6(4): E105-E120.
43、She X, Guo J, Liu X, et al. Reliability of vessel density measurements in the peripapillary retina and correlation with retinal nerve fiber layer thickness in healthy subjects using optical coherence tomography angiography. Ophthalmologica. 2018, 240(4): 183-190. DOI: 10.1159/000485957.She X, Guo J, Liu X, et al. Reliability of vessel density measurements in the peripapillary retina and correlation with retinal nerve fiber layer thickness in healthy subjects using optical coherence tomography angiography. Ophthalmologica. 2018, 240(4): 183-190. DOI: 10.1159/000485957.
44、Nesper PL, Fawzi AA. Human parafoveal capillary vascular anatomy and connectivity revealed by optical coherence tomography angiography. Invest Ophthalmol Vis Sci. 2018, 59(10): 3858-3867. DOI: 10.1167/iovs.18- 24710.Nesper PL, Fawzi AA. Human parafoveal capillary vascular anatomy and connectivity revealed by optical coherence tomography angiography. Invest Ophthalmol Vis Sci. 2018, 59(10): 3858-3867. DOI: 10.1167/iovs.18- 24710.
45、Kohan DE, Barton M. Endothelin and endothelin antagonists in chronic kidney disease. Kidney Int. 2014, 86(5): 896-904. DOI: 10.1038/ki.2014.143.Kohan DE, Barton M. Endothelin and endothelin antagonists in chronic kidney disease. Kidney Int. 2014, 86(5): 896-904. DOI: 10.1038/ki.2014.143.
46、Ehling%20J%2C%20B%C3%A1b%C3%AD%C4%8Dkov%C3%A1%20J%2C%20Gremse%20F%2C%20et%20al.%20Quantitative%20micro%02computed%20tomography%20imaging%20of%20vascular%20dysfunction%20%0Ain%20progressive%20kidney%20diseases.%20J%20Am%20Soc%20Nephrol.%202016%2C%20%0A27(2)%3A%20520-532.%20DOI%3A%2010.1681%2FASN.2015020204.Ehling%20J%2C%20B%C3%A1b%C3%AD%C4%8Dkov%C3%A1%20J%2C%20Gremse%20F%2C%20et%20al.%20Quantitative%20micro%02computed%20tomography%20imaging%20of%20vascular%20dysfunction%20%0Ain%20progressive%20kidney%20diseases.%20J%20Am%20Soc%20Nephrol.%202016%2C%20%0A27(2)%3A%20520-532.%20DOI%3A%2010.1681%2FASN.2015020204.
47、Culshaw GJ, MacIntyre IM, Dhaun N, et al. Endothelin in nondiabetic chronic kidney disease: preclinical and clinical studies. Semin Nephrol. 2015, 35(2): 176-187. DOI: 10.1016/j.semnephrol.2015.03.002.Culshaw GJ, MacIntyre IM, Dhaun N, et al. Endothelin in nondiabetic chronic kidney disease: preclinical and clinical studies. Semin Nephrol. 2015, 35(2): 176-187. DOI: 10.1016/j.semnephrol.2015.03.002.
48、Dhaun N, MacIntyre IM, Melville V, et al. Blood pressureindependent reduction in proteinuria and arterial stiffness after acute endothelin-a receptor antagonism in chronic kidney disease. Hypertension. 2009, 54(1): 113-119. DOI: 10.1161/HYPERTENSIONAHA.109.132670.Dhaun N, MacIntyre IM, Melville V, et al. Blood pressureindependent reduction in proteinuria and arterial stiffness after acute endothelin-a receptor antagonism in chronic kidney disease. Hypertension. 2009, 54(1): 113-119. DOI: 10.1161/HYPERTENSIONAHA.109.132670.
49、Dhaun N, Moorhouse R, MacIntyre IM, et al. Diurnal variation in blood pressure and arterial stiffness in chronic kidney disease: the role of endothelin-1. Hypertension. 2014, 64(2): 296-304. DOI: 10.1161/ HYPERTENSIONAHA.114.03533.Dhaun N, Moorhouse R, MacIntyre IM, et al. Diurnal variation in blood pressure and arterial stiffness in chronic kidney disease: the role of endothelin-1. Hypertension. 2014, 64(2): 296-304. DOI: 10.1161/ HYPERTENSIONAHA.114.03533.
50、Moir J, Khanna S, Skondra D. Review of OCT angiography findings in diabetic retinopathy: insights and perspectives. Int J Transl Med. 2021, 1(3): 286-305. DOI: 10.3390/ijtm1030017.Moir J, Khanna S, Skondra D. Review of OCT angiography findings in diabetic retinopathy: insights and perspectives. Int J Transl Med. 2021, 1(3): 286-305. DOI: 10.3390/ijtm1030017.
51、Takase N, Nozaki M, Kato A, et al. Enlargement of foveal avascular zone in diabetic eyes evaluated by en face optical coherence tomography angiography. Retina. 2015, 35(11): 2377-2383. DOI: 10.1097/IAE.0000000000000849.Takase N, Nozaki M, Kato A, et al. Enlargement of foveal avascular zone in diabetic eyes evaluated by en face optical coherence tomography angiography. Retina. 2015, 35(11): 2377-2383. DOI: 10.1097/IAE.0000000000000849.
52、Kasumovic A, Matoc I, Rebic D, et al. Assessment of retinal microangiopathy in chronic kidney disease patients. Med Arch. 2020, 74(3): 191-194. DOI: 10.5455/ medarh.2020.74.191-194.Kasumovic A, Matoc I, Rebic D, et al. Assessment of retinal microangiopathy in chronic kidney disease patients. Med Arch. 2020, 74(3): 191-194. DOI: 10.5455/ medarh.2020.74.191-194.
53、Rosen RB, Andrade Romo JS, Krawitz BD, et al. Earliest evidence of preclinical diabetic retinopathy revealed using optical coherence tomography angiography perfused capillary density. Am J Ophthalmol. 2019, 203: 103-115. DOI: 10.1016/j.ajo.2019.01.012.Rosen RB, Andrade Romo JS, Krawitz BD, et al. Earliest evidence of preclinical diabetic retinopathy revealed using optical coherence tomography angiography perfused capillary density. Am J Ophthalmol. 2019, 203: 103-115. DOI: 10.1016/j.ajo.2019.01.012.
1、This work is supported by the National Natural Science Foundation of China (92368205), the National Natural Science Foundation of China (82171035), the High-level Science and Technology Journals Projects of Guangdong Province (2021B1212010003), the Science and Technology Planning Project of Guangdong Province (2023A1111120011), the Science and Technology Planning Project of Guangzhou City (2024B03J1233), the Science and Technology Planning Projects of Guangdong Province (2021B1111610006), and the Basic Scientific Research Projects of Sun Yat-sen University (23ykcxqt002). China Chronic Kidney Disease Management Innovation Program (202206080010), the National Natural Science Foundation of China (82170762), the National Natural Science Foundation of Guangdong, China (2022A1515012637), “Three big” Construction of Large Science Program of Sun Yat-sen University, China (82000-18843406).()
上一篇
下一篇
出版者信息
目录