您的位置: 首页 > 2025年6月 第2卷 第2期 > 文字全文
2023年7月 第38卷 第7期11
目录

Economic outcomes of AI-based diabetic retinopathy screening: a systematic review and meta-analysis

Economic outcomes of AI-based diabetic retinopathy screening: a systematic review and meta-analysis

来源期刊: Eye Science | 2025年6月 第2卷 第2期 121-135 发布时间:2025-06-20 收稿时间:2025/6/27 18:27:48 阅读量:689
作者:
关键词:
economic evaluation incremental net benefit meta-analysis artificial intelligence diabetic retinopathy
DOI:
10.12419/es25011003
Received date:
2025-01-13 
Revised date:
2025-03-03 
Accepted date:
2025-04-01 
Published online:
2025-06-20 
Objective: Diabetic retinopathy (DR) is a top leading cause of blindness worldwide, requiring early detection for timely intervention. Artificial intelligence (AI) has emerged as a promising tool to improve DR screening efficiency, accessibility, and cost-effectiveness. This study conducted a systematic review of literature and meta-analysis on the economic outcomes of AI-based DR screening. Methods: A systematic review of studies published before September 2024 was conducted throughout PubMed, Scopus, Embase, the Cochrane Library, the National Health Service Economic Evaluation Database, and the Cost-Effectiveness Analysis Registry. Eligible studies were included if they were (1) conducted among type 1 diabetes mellitus or type 2 diabetes mellitus  adult diabetic population; (2) studies compared AI-based DR screening strategy to non-AI screening; and (3) performed a cost-effectiveness analysis. Meta-analysis was applied to pool incremental net benefit (INB) across studies stratified by country income and study perspective using a random-effects model. Statistical heterogeneity among studies was assessed using the I2 statistic, Cochrane Q statistics, and meta regression. Results: Nine studies were included in the analysis. From a healthcare system/payer perspective, AI-based DR screening was significantly cost-effective compared to non-AI-based screening, with a pooled INB of 615.77 (95% confidence interval [CI]: 558.27-673.27). Subgroup analysis showed robust cost-effectiveness of AI-based DR screening in high-income countries (INB = 613.62, 95% CI: 556.06-671.18) and upper-/lower- middle income countries (INB = 1,739.97, 95% CI: 423.13-3,056.82) with low heterogeneity. From a societal perspective, AI-based DR screening was generally cost-effective (INB= 5,102.33, 95% CI: -815.47-11,020.13), though the result lacked statistical significance and showed high heterogeneity. Conclusions: AI-based DR screening is generally cost-effective from a healthcare system perspective, particularly in high-income countries. Heterogeneity in cost-effectiveness across different perspectives highlights the importance of context-specific evaluations, to accurately evaluate the potential of AI-based DR screening in reducing global healthcare disparities.

HIGHLIGHTS

· AI-based diabetic-retinopathy screening (DR) is cost-effective from a healthcare system perspective, particularly in high-income countries. 
· By pooling incremental net benefit (INB) estimates for various AI-based comparisons and stratifying analyses according to the identified heterogeneity, our meta-analysis quantified the economic costs and health outcomes of AI-based DR screening, to assist the future guidance of AI-enabled DR screening programs worldwide.
· Given its advantages in reducing healthcare disparities and optimizing resource allocation, AI has the potential to become a powerful tool for DR screening. Heterogeneity in cost-effectiveness across different perspectives highlights the importance of context-specific evaluations, to accurately evaluate the potential of AI-based DR screening in reducing global healthcare disparities.

INTRODUCTION

Artificial intelligence (AI) has become a transformative tool in healthcare, particularly in medical image analysis for early disease detection[1]. Its application has been especially successful in diabetic retinopathy (DR), a top leading cause of blindness among working-age adults. DR affects around one in three diabetic individuals [2], with the age-standardized global prevalence of blindness due to DR increased from 14.9% to 18.5% between 1990 and 2020, imposing significant healthcare and socioeconomic burdens[3]. In this context, AI-based systems have shown high accuracy and efficiency in detecting DR from retinal images[4,5]. By facilitating early detection and timely intervention, AI-based DR screening strategies hold the potential to improve patient care, expand access to expertise in remote areas, and address the global health burden posed by DR[6].
 
Despite the promising performance of AI-based DR screening, the value and feasibility of this software as a medical device for widespread implementation widespread implementation in real-world clinical settings require careful assessment. Heath-economic evaluations, such as cost-effectiveness analysis, are essential for understanding the potential benefits of AI and for guiding policymaking and resource allocation[7,8]. Over the past decade, numerous studies have evaluated the economic costs and health outcomes of AI-based DR screening in countries such as Brazil, China and the United States. However, their findings were inconsistent, partially due to differences in study focus, context and methodologies[9–13]. As a result, decision-makers often face overwhelming amounts of information and conflicting conclusions, which complicates the formation of clear policy directives. While some evaluations provide only descriptive summaries without standardized effect measures, this lack of quantitative synthesis makes it difficult to integrate results or pinpoint sources of heterogeneity. Moreover, disparities in income levels, healthcare systems, and research perspectives further hinder the generalizability of conclusions across different settings, especially in countries where context-specific economic evaluations are not available. 

To address these gaps, we performed a systematic review and meta-analysis to quantify the economic costs and health outcomes of AI-based DR screening, providing a quantitative assessment of its performance from a health-economic perspective. By pooling incremental net benefit (INB) estimates for various AI-based comparisons and stratifying analyses according to the identified heterogeneity, our study aims to provide robust evidence to inform policy-making and assist the future guidance of AI-enabled DR screening programs worldwide.

METHODS

This systematic review and meta-analysis was performed following the Preferred Reporting Items for Systematic Reviews and Meta-Analyses Protocols[14] and was registered at PROSPERO (No. CRD42024583940).

Data Sources and Search Strategy

A systematic search of the literature was conducted on 1st September 2024 across multiple databases, including PubMed, Scopus, Embase, the Cochrane Library, the National Health Service Economic Evaluation Database, and the Cost-Effectiveness Analysis Registry. The search strategy incorporated a combination of keywords including “artificial intelligence” or "AI" or "deep learning" or "machine learning", “diabetic retinopathy” OR "DR" OR "diabetic macular edema" OR "diabetic macular oedema", “economic outcomes” or "economic evaluation" or “cost-effectiveness” or “cost-utility”. Additionally, the reference lists of eligible studies and relevant reviews were also reviewed to retrieve other potentially relevant studies. No language restriction was applied. Full search strategies were shown in Supplementary Table 1.

Supplementary Table 1 Searching strategies about the economic outcomes of AI-based diabetic retinopathy screening

Data source

Searching strategy

Pubmed

("artificial intelligence" OR "AI" OR "deep learning" OR "machine learning") AND ("diabetic retinopathy" OR "DR" OR "diabetic macular edema" OR "diabetic macular oedema") AND ("economic outcomes" OR "economic evaluation" OR "cost-effectiveness" OR "cost-utility")

Scopus

TITLE-ABS-KEY(("economic outcomes" OR "economic evaluation" OR "cost-effectiveness" OR "cost-utility") AND ("artificial intelligence" OR "AI" OR "deep learning" OR "machine learning") AND ("diabetic retinopathy" OR "DR" OR "diabetic macular edema" OR "diabetic macular oedema"))

Cochrane Library

("artificial intelligence" OR "AI" OR "deep learning" OR "machine learning") AND ("diabetic retinopathy" OR "DR" OR "diabetic macular edema" OR "diabetic macular oedema") AND ("economic outcomes" OR "economic evaluation" OR "cost-effectiveness" OR "cost-utility")

Web of Science

("artificial intelligence" OR "AI" OR "deep learning" OR "machine learning") AND ("diabetic retinopathy" OR "DR" OR "diabetic macular edema" OR "diabetic macular oedema") AND ("economic outcomes" OR "economic evaluation" OR "cost-effectiveness" OR "cost-utility")

NHS Economic Evaluation Database

"artificial intelligence" OR "AI" OR "deep learning" OR "machine learning") AND ("diabetic retinopathy" OR "DR" OR "diabetic macular edema" OR "diabetic macular oedema"

CEA Registry

("artificial intelligence" OR "AI" OR "deep learning" OR "machine learning") AND ("diabetic retinopathy" OR "DR" OR "diabetic macular edema" OR "diabetic macular oedema") 

Additional search from review and reference

1 preprint

2 from reference of a relevant systematic review

Study Selection

Two researchers independently screened the titles and abstracts of the literature. Full articles were reviewed if a decision could not be made based on the abstract. Any disagreements were discussed and resolved with a third researcher. Eligible studies were included if they met the following criteria: (1) conducted among adult diabetic population, including both type 1 diabetes mellitus and type 2 diabetes mellitus; (2) studies compared AI-based DR screening strategy to non-AI screening (including manual screening or no screening), regardless of the specific approach used (e.g., AI used independently or as an assistive tool for human decision-making); and (3) performed a cost-effectiveness analysis and reported at least one health economic outcome including incremental cost-effectiveness ratio (ICER), incremental net benefit (INB), incremental cost (ΔC), and incremental effectiveness (quality-adjusted life years (QALYs)). Studies were excluded if they were review studies. Furthermore, studies with insufficient data for pooling were excluded from meta-analysis.

Data Extraction

Data were extracted by two researchers separately and recorded in a structured spreadsheet. Any disagreements were resolved through discussion with a third researcher. The data extraction was conducted based on the Consolidated Health Economic Evaluation Reporting Standard (CHEERS) statement[15,16], the structured abstracts of economic evaluations in the NHS Economic Evaluation Database (NHS EED)[17], and the Centre for Reviews and Dissemination (CRD) guidance[18]
The data extraction form included the following five components:
1)General article information including, study ID, first author and correspondence author, journal and year of publication.
2)General study characteristics including country of the study, country income level, type of economic evaluation, modelling approach, study perspectives, setting level.
3)General characteristic of participants and intervention/comparison including, age distribution of participants, screening strategies, status quo, and diagnostic performance of AI and human graders.
4)Study methods of economic evaluation include time horizon, cycle length, discount rate applied to costs and health outcomes, base cost year and currency, type of outcome measures, cost-effective threshold, and sensitivity analyses performed.
5)The health economic outcomes include mean and incremental cost (ΔC), mean and incremental effectiveness (ΔE), and ICERs. Standard deviation (SD) or 95% confidence interval (CI) for these parameters were also extracted if possible. Data for pooling were extracted including mean of cost or outcome with their dispersion. 
Where health economic outcomes were not explicitly reported in numerical values, data were extracted from cost-effectiveness plane graphs, when available. Additionally, cost-effectiveness thresholds or willingness-to-pay (WTP) thresholds were recorded. If WTP thresholds were not reported, they were estimated based on three times the per-capita gross domestic product (GDP) for the country in the publication year, following the World Health Organization (WHO)’s recommendation.

Risk of bias assessment

Considering model- or trial-based economic evaluations, risk of bias was assessed using the Bias in Economic Evaluation (ECOBIAS) checklist consisting of 22 items. Each item was rated as yes, no, partly, unclear, or not applicable, depending on the study's adherence to methodological standards.

Interventions and economic outcomes

Interested interventions were AI-based DR screening. The comparator was determined as non-AI screening (manual screening) or no screening.

Data Preparation

Since individual studies used different currencies and base years, all costs were converted to a 2023 cost metric using the consumer price index (CPI) and expressed in United States dollars (US$). The primary economic outcome measure was INB[19–21], which was calculated as follows: INB = K(ΔE)−ΔC, where K is the cost-effectiveness thresh- old or WTP, ΔE, and ΔC are the difference of QALYs and cost between intervention and comparator. Here we selected INB as the effect measure rather than ICER because its positive or negative value directly indicates cost-effectiveness or non-cost-effectiveness, respectively, and its linearity facilitates straightforward statistical analysis. In contrast, negative ICER values may indicate a lower cost with higher effectiveness or high cost with lower effectiveness, which could introduce interpretive ambiguity. Those studies reported the ICERs were converted to the INB as INB = ΔE (K−ICER). Variance of INB could be calculated using the following formulas: Var(INB) = K2σ2ΔE + σ2ICER, or Var(INB) = K2σ2ΔE + σ2ΔC – 2KρΔCΔE. Due to variation in reporting across economic evaluation studies, INB and its variance were estimated under five scenarios, following previous recommendations[22](Supplementary Table 2).

Supplementary Table 2 Data preparation method for INB and its variance

SCENARIO 1:

Studies reported means and its dispersion measure (SD/SE) for costs (C), effective (E), ΔC, ΔE, and ICER/ICUR. INB and its variance can be calculated directly from any of the formulas: Var(INB) = K2σ2ΔE + σ2ICER, or Var(INB) = K2σ2ΔE + σ2ΔC – 2KρΔCΔE, Where σ2ΔC, σ2ΔE, ρΔ𝐸Δ𝐶 are variances of ΔC and ΔE and their covariance, and σ2ICER is variance of ICER.

SCENARIO 2:

Studies reported ICER/ICUR along with its 95% CI. The variance of ICER can be calculated by the formulas below: 95% CI (μICER) = μmean ICER+1.96*SE ICER, than the variance of INB can be calculated from: Var(INB) = K2σ2ΔE + σ2ICER.

SCENARIO 3:

Studies reported means along with measures of dispersion (95% CI, SD/SE) of C, E, or ΔC/ΔE, but not ICER/ICUR. INB and its variance can be calculated from the formulas: Var(INB) = K2σ2ΔE + σ2ICER, or Var(INB) = K2σ2ΔE + σ2ΔC – 2KρΔCΔE. Data are used to simulate C/ΔC and E/ΔE with 1000 replications using Monte Carlo methods with gamma and normal distributions for C/ΔC and E/ΔE, respectively.

SCENARIO 4:

Studies reported only CE-plane. Individual values of ΔC and ΔE data can be manually extracted from the CE plane using Web-Plot-Digitizer software. Then, means of ΔC, ΔE, and their variances and covariances can be estimated accordingly. INB and its variance can be calculated from the formulas: Var(INB) = K2σ2ΔE + σ2ΔC – 2KρΔCΔE.

Scenario 5:

Studies did not report neither dispersion nor the CE-plane, but only provide the deterministic analysis means (or point estimates) of costs, outcomes, and ICER. Dispersion measures can be borrowed from a similar study if: it is in the same income stratum; or has a similar model type and inputs (perspective, discounting, time horizon); or compares the same intervention and comparator over a similar time period and region; or has ICERs within ±50% to 75% of each other. If multiple studies qualify, the average of their variances can be used.

 Data were prepared for pooling based on five scenarios as follows.

Statistical analysis

Statistical analysis was conducted to evaluate the pooled INB across studies. It was stratified by country income levels, according to the World Bank classification (high income countries (HICs), upper- or lower-middle income countries (U/LMICs), etc.) and study perspective (healthcare system/payer and societal). For studies reporting results on multiple populations, the weighted average estimate of INB and its variance was used in the main analysis.

Fixed effects modeling using the inverse-variance method was applied when no significant heterogeneity was detected, other-wise a random effects model was applied[23]. The intervention was considered cost-effective if the pooled INB was positive (i.e., favoring the intervention), otherwise it was not cost-effective. Heterogeneity was assessed by the Cochrane’s Q test, I² statistic and meta regression. Subgroup analyses were conducted to explore potential sources of heterogeneity, such as differences in country income levels or comparison methods. In addition, a 95% CI was calculated estimate whether the pooled INB would remain cost-effective in other settings. Publication bias was assessed using funnel plots and Egger’s test. If asymmetry was identified, contour-enhanced funnel plots were used to differentiate potential causes. A series of pre-specified sensitivity analyses were performed by excluding studies with following conditions: (1) time horizon <10 years; (2) high risk of bias and (3) scenario 5 (imputing variance using absolute value borrowing from similar studies). Data pooling was undertaken using Microsoft® Excel version 2019 and analyzed using STATA® version 16. A two-sided p value < 0.05 was considered statistically significant.

RESULTS

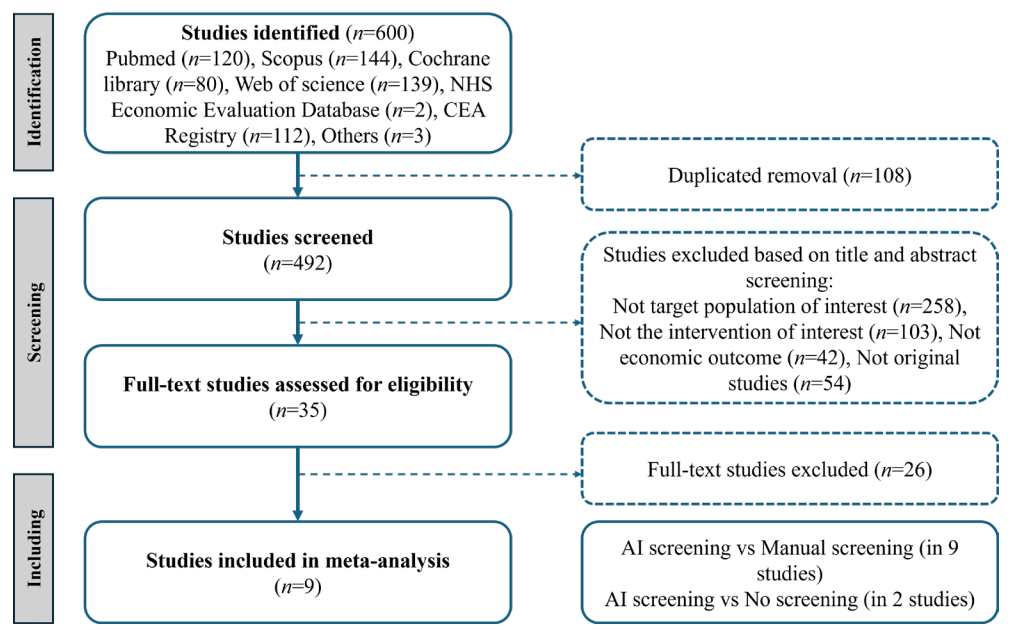
Of the six hundred identified studies, nine studies were eligible for the meta-analysis[9,11–13,24–28](Figure 1), including eleven comparisons: nine comparisons between AI screening and manual screening, two comparisons between AI screening and no screening.

Figure 1 Preferred Reporting Items for Systematic Reviews and Meta-Analyses (PRISMA) flow diagram

20250711164200_7270.png

Study characteristics

Geographically, three studies were conducted in high-income countries, while six were conducted in middle-income countries. All studies evaluated manual tiered screening strategies, with two also assessing no-screening scenarios. The Markov model was used in all studies. Healthcare provider or health system perspective was most commonly adopted analytical perspective, featured in seven studies, while four adopted a societal perspective. Sensitivity and specificity of AI-based screening strategies ranged from 0.80 to 0.98 and 0.91 to 0.99, respectively. In comparison, the sensitivity and specificity of the status quo ranged from 0.73 to 1.00 and 0.92 to 1.00, respectively. Discount rates for cost and efficiency were between 3% and 3.5%, and time horizons varied from nine year to lifetime. Details of these studies were shown in Table 1. 

Risk-of-bias assessment

We used the ECOBIAS checklist to evaluate the risk of bias. Biases were reported in the dissemination bias, limited time horizon bias, data identification and incorporation bias, limited sensitivity analysis and scope bias, and bias related to internal consistency. Two studies were classified as low risk of bias (2/9, 22.2%), four studies (4/9, 44.4%) were identified with moderate and three were with high risk of bias (3/9, 33.3%). Results from a risk of bias assessment are described in Supplementary Table 3.

Supplementary Table 3 Risk of bias assessment

Type of bias

Hu, 2024

Srisubat, 2023

Lin, 2023

Li, Preprint

Li, 2023

Chawla, 2023

Huang, 2022

Gomez, 2022

Fuller, 2022

PART A. Overall checklist for bias in economic evaluation

1. Narrow perspective bias

N

N

N

N

N

N

N

N

N

2. Inefficient comparator biasa

N

N

N

N

N

N

N

N

N

3. Cost measurement omission

N

N

N

N

N

N

N

N

N

4. Intermittent data collection

N

N

N

N

N

N

N

N

N

5. Invalid valuation bias

N

N

N

N

N

N

N

N

N

6. Ordinal ICER bias

N

N

N

N

N

N

N

N

N

7. Double-counting bias

N

N

N

N

N

N

N

N

N

8. Inappropriate discounting

N

N

N

N

N

N

N

N

N

9. Limited sensitivity analysisb

N

N

P

P

P

P

N

P

P

10. Sponsor bias

N

N

N

N

N

N

N

N

N

11. Reporting and dissemination bias

U

U

U

U

U

U

U

U

U

PART B. Model-specific aspects of bias in economic evaluation

I: Bias related to structure

12. Structural assumptions

N

N

N

N

N

N

N

N

N

13. No treatment comparatora

N

N

N

N

N

N

N

N

N

14. Wrong model bias

N

N

N

N

N

N

N

N

N

15. Limited time horizon bias

P

Y

P

P

P

P

P

N

Y

II: Bias related to data

16. Bias related to data identification

N

N

N

P

U

P

P

U

U

17. Bias related to baseline data

N

N

N

N

N

N

N

N

N

18. Bias related to treatment effects

N

N

N

N

N

N

N

N

N

19. Bias related to quality of-life weights (utilities)

N

N

N

N

N

N

N

N

N

20. Non-transparent data incorporation bias

N

N

N

P

U

P

P

U

U

21. Limited scope biasb

N

N

P

P

P

P

N

P

P

III: Bias related to consistency

22. Bias related to internal consistency

U

U

U

U

U

U

U

U

U

Overall

Low

Low

Moderate

High

Moderate

High

High

Moderate

Moderate

Pooled INBs based on healthcare system/payer perspective

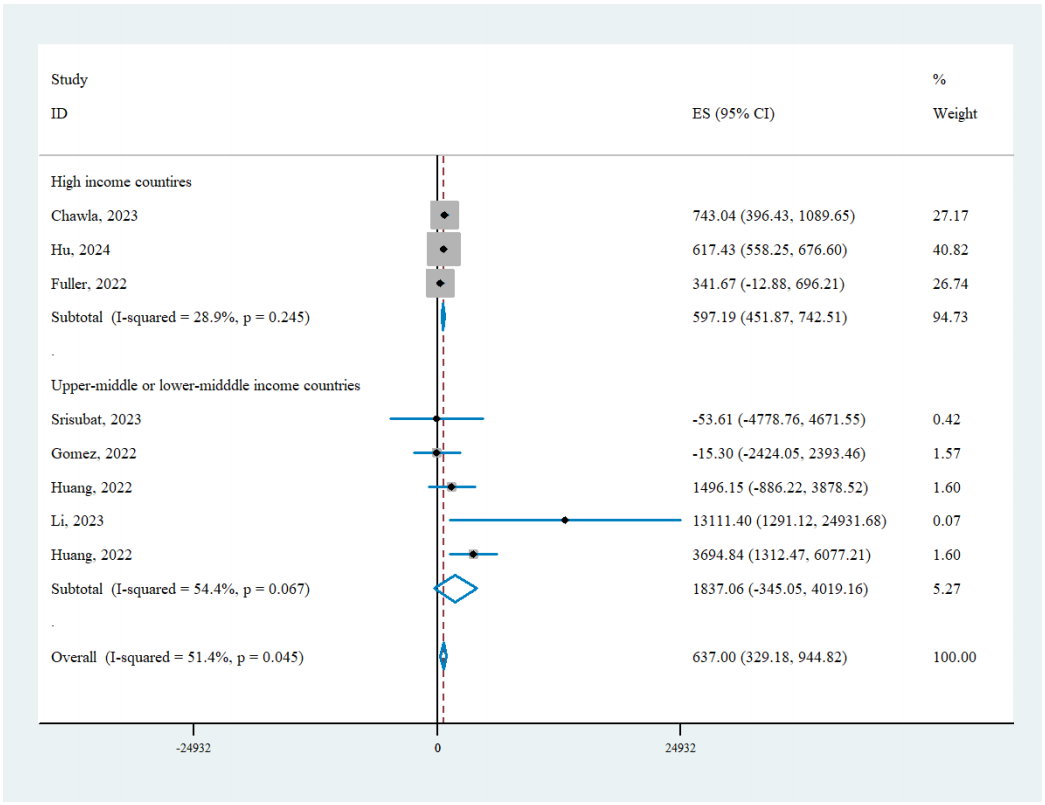
Seven studies, including eight comparisons of AI-based screening versus the status quo, were analyzed. Among these studies, three were conducted in HIC while the remaining four were conducted in U/LMICs. In general, the pooled INB showed that AI-based DR screening was significantly and robustly cost-effective when compared to conventional manual screening from the healthcare system/payer perspective (INB= 615.77, 95% CI: 558.27-673.27). While heterogeneity was noted, publication bias was not detected based on Egger’s test (Egger’s test, P=0.32). Therefore, we performed subgroup analyses based on the country’s income level. AI-based DR screening was found to be cost-effective in both HICs (INB = 613.62, 95% CI: 556.06, 671.18) and U/LMICs (INB = 1739.97, 95% CI: 423.13, 3056.82) with low heterogeneity (HIC, I2=28.9%, P=0.25; U/LMIC, I2=54.4%, P=0.07).

Pooled INBs based on societal perspective

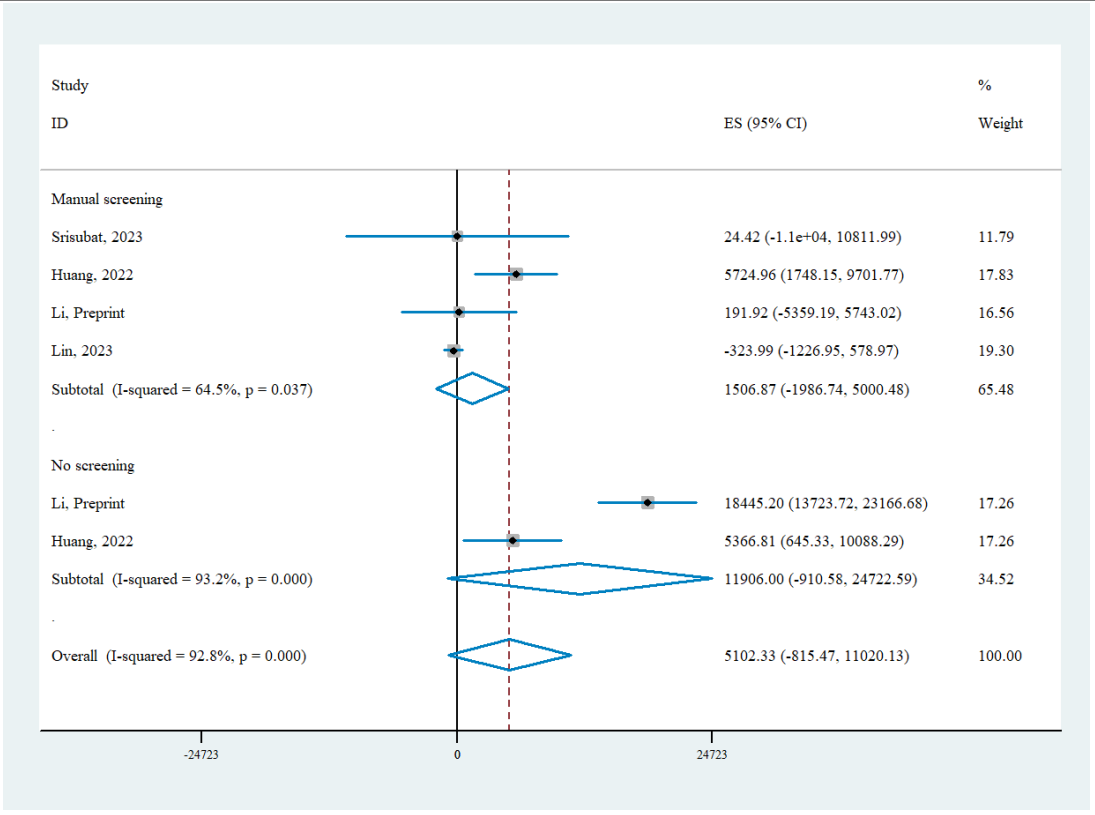
Four studies with six comparisons of AI screening versus status quo were analyzed from societal perspectives. The pooled INB indicated that AI-based DR screening was cost-effective in general from societal perspective (INB= 5,102.33, 95% CI: -815.47-11,020.13), but the results did not reach statistical significance. Significant heterogeneity was observed in funnel plot, yet Egger’s test indicated no evidence of publication bias (Egger’s test, P=0.18). Since all the studies were conducted in U/LMICs, we stratified the studies by the comparator strategy (either manual screening or no screening). AI-based DR screening was found cost-effective in comparison with both strategies (manual screening INB = 1,506.87, 95% CI: -1,986.74-5,000.48; no screening INB = 11,906.00, 95% CI: -910.58-24,722.59), although neither subgroup analysis reached statistical significance and substantial heterogeneity persisted (manual screening I2=64.5%; no screening I2=93.2%). The 95% CI indicated that the true effect in future settings could be either null or aligned with the direction of the pooled INB.

Table 1 Characteristic of the included studies

Study

Perspective

Results

Income

Country

AI type

Status quo

AI Se

AI Sp

Status quo Se

Status quo Sp

Age(mean age), years

Time horizons, years

Base cost year

Discount rate for cost and outcome

Scenario of economic parameters

WTP thresholds (times GDP per capita)

Hu, 2024(12)

Healthcare provider

Dominant

HIC

Australia

DLa

Manual screening by optometrists, ophthalmologists and general practitioners

0.97

0.91

0.73

0.93

>20, (65)

40

2022

0.035

4

Fixed value

Srisubat, 2023(24)

Societal; Healthcare provider

Dominant

U/LMIC

Thailand

DL

Manual screening by trained non-physician human graders

0.95

0.98

0.74

0.986

40

lifetime

2020

0.03

4

Fixed value

Lin, 2023(9)

Societal

Cost-saving

U/LMIC

China

DL

Manual screening by ophthalmologists

0.80

0.98

1

1

65

30

2020

0.035

4

3

Li, Preprint(26)

Societal

Dominant; Cost-effective

U/LMIC

China

DL

Manual screening by ophthalmologists; No screening

0.98

0.97

0.93

0.98

≥50

30

2022

0.03

4

3

Li, 2023(11)

Health system

Dominant

U/LMIC

China

DLb

Manual screening by ophthalmologists

0.91

0.99

0.96

0.95

(63.75)

50

2019

0.03

4

3

Chawla, 2023(27)

Healthcare provider

Dominant

HIC

US

DL (FARIS)c

Referral to standard screening of DR undertaken by ophthalmologists

0.91

0.91

0.87

0.95

45

20

2021

0.03

4

Fixed value

Huang, 2022(25)

Societal; Health system

Dominant; Cost-effective; Dominant; Cost-effective

U/LMIC

China

DL

Manual screening by ophthalmologists; no screening

0.91

0.99

0.96

0.95

44

35

2020

0.03

5

3

Gomez, 2022(28)

Healthcare provider

Dominated

U/LMIC

Brazil

DL

Referral to standard screening of DR undertaken by ophthalmologists

0.87

0.91

0.83

0.92

>40

lifetime

2020

0.03

3

3

Fuller, 2022(13)

Healthcare provider

Cost-saving

HIC

US

DL (ARIAS)d

Referral to Standard, in-office dilated eye examinations

NA

NA

NA

NA

>18

5

2019

0.03

5

Fixed value

 WTP: willingness to pay; Se: sensitivity; Sp: specificity; HIC: high income countries; U/LMIC: upper-middle/ lower-middle income countries; DL: deep learning system; FARIS: fully automated a c retinal image screening; ARIAS: automated retinal image analysis systems; DL : Eyetelligence; DL: EyeWisdom; DL : EyeArt 2.0; DLd: IDx-DR and EyeArt 2.0; NA: not applicable.

Sensitivity analysis and sources of heterogeneity

From a healthcare system perspective, AI-based DR screening showed modest and robust INBs, particularly in HICs, where the INB was 615.77 (95% CI: 558.27-673.27) with low heterogeneity (I2 = 25.3%). When limiting the analysis to studies with time horizons of >5 years or excluding studies using scenario 5 in high-income countries, the INB increased slightly to 620.99 (95% CI: 562.65, 679.32), and heterogeneity was completely eliminated (I2 = 0.0%). Excluding studies with high risk of bias also yielded similar statistically significant results, further supporting the robustness of the results (INB: 609.95, 95% CI: 551.59-668.32). In U/LMICs, while AI screening was cost-effective overall, the results were not statistically robust when short time horizon, high-risk studies or specific scenarios were excluded,  (Table 2). In contrast, under the societal perspective, sensitivity analyses revealed substantial heterogeneity across most comparisons, indicating variability among included studies. Excluding high-risk bias studies or scenario 5 can eliminate the heterogeneity in manual screening comparisons (I2 = 0%). However, in these cases, the INBs indicated that AI screening was not cost-effective, statistically (INB=-302.15, 95% CI: -1,211.81-607.50) (Table 3). Overall, AI screening was generally cost-effective in HICs, and heterogeneity in time horizon, study quality and highlights variability across studies particularly in U/LMICs and from a societal perspective. Besides, our meta-regression analysis showed that AI specificity was positively correlated with the INBs from a healthcare system perspective (P=0.031), in addition to status quo comparator type (P=0.031 and P=0.011 in societal and healthcare perspective, respectively) (Table 4).

Table 2 Sensitivity analyses of AI screening vs non-AI screening under healthcare system/payer perspective


Meta-analysis


No. of studies / No. of comparison

INB (95% CI)

I-squared

High-income countries

Overall

3/3

615.77 (558.27, 673.27) *

25.3%

Time horizon>5

2/2

620.99 (562.65, 679.32) *

0.00%

Excluding high risk of bias studies

2/2

609.95 (551.59, 668.32) *

55.8%

Excluding scenario 5

2/2

620.99 (562.65, 679.32) *

0.00%

Upper or low-middle income countries

Overall

4/5

1739.97 (423.13, 3056.82) *

54.4%

Excluding high risk of bias studies

3/3

395.92 (-1715.57, 2507.40)

56.4%

Excluding scenario 5

2/2

395.92 (-1715.57, 2507.40)

56.4%

 *P < 0.05.

Table 3 Sensitivity analyses of AI screening vs non-AI screening under societal perspective


Meta-analysis


No. of studies / No. of comparison

INB (95% CI)

I-squared

Upper or Low-middle income countries

Overall

4/6

5102.33 (-815.47, 11020.13)

92.8%

Excluding high risk of bias studies

3/4

4775.51 (-4935.97, 14486.99)

94.9%

Excluding scenario 5

3/4

4775.51 (-4935.97, 14486.99)

94.9%

Manual Screening

4/4

1506.87 (-1986.74, 5000.48)

64.5%

Excluding scenario 5

3/3

-308.42 (-1196.64, 579.80)

0

Excluding high risk of bias studies

3/3

-308.42 (-1196.64, 579.80)

0

No Screening

2/2

11906.00 (-910.58, 24722.59)

93.2%

Excluding scenario 5

1/1

18445.20 (13723.72, 23166.67)

/

 *P < 0.05.

Table 4 Results of the meta-regression analysis of the economic outcome for AI-based DR screening

Perspective

Covariates

Coefficient (95%CI)

P value

Societal

Status quo

(Manual screening)

-10,351.72 (-19,736.72, -966.73)

0.031


AI sensitivity

48,900.43 (-44,247.92, -142,048.80)

0.304


AI specificity

39,390.44 (-45,889.74, 124,670.60)

0.866

Health care

Status quo

(Manual screening)

-3,080.86 (-5,463.93, -697.80)

0.011


AI sensitivity

-6,309.70 (-34,767.00, 22,417.61)

0.664


AI specificity

24,851.28 (2,224.57, 47,477.99)

0.031

Discussion

As AI continues to gain recognition for its potential in DR screening, questions around the cost-effectiveness of AI-based screening strategy are increasingly critical to consider. This systematic review and meta-analysis included 9 studies with 11 comparisons assessing the cost-effectiveness of AI-based screening versus manual or no screening. Overall, AI-based DR screening was generally cost-effective from a healthcare system perspective, particularly in HICs. From a societal perspective, AI-based screening also demonstrated cost-effectiveness but lacked statistical significance; yet significant heterogeneity was observed, highlighting the need for cautious interpretation when generalizing findings across different settings.


Our findings indicated that from a healthcare system or payer perspective, AI-based DR screening demonstrated strong cost-effectiveness, and higher INBs were found in U/LMICs compared to HICs. Two studies in US and one study in Australia indicated that AI screening was more cost-effective than human graders[12,13,27]. One predominant reason was that the costs of manual grading were relatively high in HICs, making AI system a more cost-saving alternative. However, the cost-effectiveness of AI screening was a more complex trade-off in U/LMICs, as it depended on the balance between the added value of automation and the local cost dynamics of traditional screening methods. On one hand, in U/LMICs, traditional screening methods were often constrained by limited infrastructure and a shortage of trained personnel[29], and AI screening can address these gaps through automation and telemedicine systems, enabling earlier and more accurate diagnoses[8]. On the other hand, low labor costs in U/LMICs may reduce the cost-saving advantage of AI screening, which may explain why studies in Brazil and Thailand found AI algorithms to be less cost-effective than human grading[24,28]. Despite these nuances, our meta-analysis proved that AI-based screening strategy was universally cost-effective and statistically significant, suggesting its promise to address healthcare gaps in both HICs and U/LMICs.

Figure 2 Pooled INB of AI-based DR screening versus status quo based on healthcare system/payer perspective

20250711164600_5914.png
From a societal perspective, AI-based DR screening was also cost-effective though showing less robustness and higher variability. Most studies on this topic have been conducted in U/LMICs, where the implementation of AI-based screening faces challenges. For example, the cost advantage of AI was less apparent in these regions due to its relatively high deployment costs, including technical maintenance and equipment upgrades, further limited its scalability and adoption potent in these regions. In HICs, DR screening is typically provided through national systematic programs with insurance reimbursement, whereas in U/LMICs, it is often provided opportunistically [29]. Although some regions offer free screening initiatives, extending such programs nationwide is often unsustainable for countries with limited healthcare budgets. Moreover, prior research indicated that even minimal out-of-pocket payments can substantially reduce patient participation in DR screening in U/LMICs. Therefore, reducing these costs while increasing screening uptake and referral adherence is critical for ensuring early diagnosis and treatment of sight-threatening conditions. In this context, leveraging low-cost telemedicine networks can be highly effective. For example, in Thailand, deep learning-based AI software is deployed in primary care centers, where non-physician staff capture and transmit retinal images for remote evaluation[24]. By utilizing existing infrastructure and telemedicine technology, overall costs are minimized. Additionally, public-private partnerships can further reduce initial investments, with governments providing the primary care framework and private partners offering AI solutions and technical support.

Figure 3 Pooled INB of AI-based DR screening versus status quo based on societal perspective

20250711164643_6839.png
High heterogeneity was observed in AI-based DR screening, especially in societal perspective. One of the reasons might be the different assumed values for input parameters. Wide variations in patient compliance (50.4%-100%) among our included studies significantly influenced the pooled INB estimates. Notably, a one-year cost-effectiveness analysis in pediatric diabetes population showed that compared to traditional screening, AI-based DR screening was the preferred strategy only when at least 23% of patients adhered to screening[30]. Additionally, cost composition varied considerably among studies. Given that AI cost calculations have not been standardized, we recommend including implementation and maintenance costs over a 10-year lifespan to capture true initial capital investment [31]. In the sensitivity analysis, studies with short time horizons or lacking dispersion metrics or a cost-effectiveness plane could introduce heterogeneity into the analysis, suggesting that standardizing research methods is essential for accurate estimation on the value of AI-based DR screening. Furthermore, in meta-regression analysis, we found that higher AI specificity was positively correlated with INB from a healthcare perspective. Higher specificity lowers false-positive rates, thereby reducing unnecessary referrals and additional diagnostic tests in the healthcare system. It is also noteworthy that cost-effectiveness analyses can differ based on perspective: while the healthcare system perspective emphasizes direct costs (e.g., referral expenses and the following treatment fee), the societal perspective considers long-term impacts including blindness. Although improving AI performance is crucial to balancing reduced up-front screening costs against potential downstream expenses, the most accurate AI model may not necessarily be the most cost-effective[32]

This study has several limitations. First, the included studies showed high heterogeneity, which may not have been fully addressed despite performing sensitivity analyses. Second, despite many studies assuming the same compliance rate for AI-based and traditional screening, the immediate feedback provided by AI could realistically boost referral adherence beyond that of traditional telemedicine approaches, which often entail a one- to two-week delay. For instance, Liu et al. demonstrated that AI-based screening raised compliance from 18.7% to 55.4% [33]. Failing to consider this potential improvement in compliance may underestimate the cost-effectiveness of AI screening. Third, many studies lacked consistent reporting of key parameters, such as the variance of cost and outcome. Future studies are encouraged to use standardized methods and provide detailed reporting of critical parameters to improve the reliability and comparability of results.

CONCLUSION

AI-based DR screening is generally cost-effective from a healthcare system perspective, particularly in HICs. Given its advantages in reducing healthcare disparities and optimizing resource allocation, AI has the potential to become a powerful tool for DR screening. However, heterogeneity introduced by different assumed values (e.g., compliance, cost, time horizon), status quo and AI performance remains a significant challenge in the comprehensive interpretation of economic evaluation of AI-based screening strategies. To address these challenges, future research should focus on standardized methodologies and reporting critical parameters in detail. Such efforts should improve the generalizability of findings and provide stronger evidence to guide policy-making and implementation strategies for AI-based DR screening.

Correction notice

None

Acknowledgement

We thank the InnoHK HKSAR Government for providing valuable supports. The research work described in this paper was majorly conducted in the JC STEM Lab of Innovative Light Therapy for Eye Diseases funded by The Hong Kong Jockey Club Charities Trust.

Author Contributions

(Ⅰ) Conception and design: Xiaotong Han, Mingguang He
(Ⅱ) Administrative support: Mingguang He
(Ⅲ) Provision of study materials or patients: Yueye Wang, Keyao Zhou, Jian Zhang
(Ⅳ) Collection and assembly of data: Yue Wu, Yueye Wang
(Ⅴ) Data analysis and interpretation: Yue Wu
(Ⅵ) Manuscript writing: All authors
(Ⅶ) Final approval of manuscript: Xiaotong Han, Mingguang He

Fundings

The study was supported by the Global STEM Professorship Scheme (P0046113), and Henry G. Leong Endowed Professorship in Elderly Vision Health.

Conflict of Interests

None of the authors has any conflicts of interest to disclose. All authors have declared in the completed the ICMJE uniform disclosure form.

Patient consent for publication

None

Ethics approval and consent to participate

None

Data availability statement

None

Open access

This is an Open Access article distributed in accordance with the Creative Commons AttributionNonCommercial-NoDerivs 4.0 International License (CC BY-NC-ND 4.0), which permits the non-commercial replication and distribution of the article with the strict proviso that no changes or edits are made and the original work is properly cited (including links to both the formal publication through the relevant DOI and the license).


1、Liu H, Li R, Zhang Y, et al. Economic evaluation of combined population-based screening for multiple blindness-causing eye diseases in China: a cost-effectiveness analysis. Lancet Glob Health. 2023, 11(3): e456-e465. DOI: 10.1016/S2214-109X(22)00554-X.Liu H, Li R, Zhang Y, et al. Economic evaluation of combined population-based screening for multiple blindness-causing eye diseases in China: a cost-effectiveness analysis. Lancet Glob Health. 2023, 11(3): e456-e465. DOI: 10.1016/S2214-109X(22)00554-X.
2、Lundeen EA, Burke-Conte Z, Rein DB, et al. Prevalence of diabetic retinopathy in the US in 2021. JAMA Ophthalmol. 2023, 141(8): 747-754. DOI: 10.1001/jamaophthalmol. 2023.2289.Lundeen EA, Burke-Conte Z, Rein DB, et al. Prevalence of diabetic retinopathy in the US in 2021. JAMA Ophthalmol. 2023, 141(8): 747-754. DOI: 10.1001/jamaophthalmol. 2023.2289.
3、Teo ZL, Tham YC, Yu M, et al. Global prevalence of diabetic retinopathy and projection of burden through 2045: systematic review and meta-analysis. Ophthalmology. 2021, 128(11): 1580-1591. DOI: 10.1016/ j.ophtha.2021.04.027.Teo ZL, Tham YC, Yu M, et al. Global prevalence of diabetic retinopathy and projection of burden through 2045: systematic review and meta-analysis. Ophthalmology. 2021, 128(11): 1580-1591. DOI: 10.1016/ j.ophtha.2021.04.027.
4、Grzybowski A, Brona P, Lim G, et al. Artificial intelligence for diabetic retinopathy screening: a review. Eye (Lond). 2020, 34(3): 451-460. DOI: 10.1038/s41433-019-0566-0.Grzybowski A, Brona P, Lim G, et al. Artificial intelligence for diabetic retinopathy screening: a review. Eye (Lond). 2020, 34(3): 451-460. DOI: 10.1038/s41433-019-0566-0.
5、He J, Cao T, Xu F, et al. Artificial intelligence-based screening for diabetic retinopathy at community hospital. Eye (Lond). 2020, 34(3): 572-576. DOI: 10.1038/s41433- 019-0562-4.He J, Cao T, Xu F, et al. Artificial intelligence-based screening for diabetic retinopathy at community hospital. Eye (Lond). 2020, 34(3): 572-576. DOI: 10.1038/s41433- 019-0562-4.
6、Li J, Guan Z, Wang J, et al. Integrated image-based deep learning and language models for primary diabetes care. Nat Med. 2024, 30(10): 2886-2896. DOI: 10.1038/s41591- 024-03139-8.Li J, Guan Z, Wang J, et al. Integrated image-based deep learning and language models for primary diabetes care. Nat Med. 2024, 30(10): 2886-2896. DOI: 10.1038/s41591- 024-03139-8.
7、Lee AY, Yanagihara RT, Lee CS, et al. Multicenter, headto-head, real-world validation study of seven automated artificial intelligence diabetic retinopathy screening systems. Diabetes Care. 2021, 44(5): 1168-1175. DOI: 10.2337/dc20-1877.Lee AY, Yanagihara RT, Lee CS, et al. Multicenter, headto-head, real-world validation study of seven automated artificial intelligence diabetic retinopathy screening systems. Diabetes Care. 2021, 44(5): 1168-1175. DOI: 10.2337/dc20-1877.
8、Xie Y, Nguyen QD, Hamzah H, et al. Artificial intelligence for teleophthalmology-based diabetic retinopathy screening in a national programme: an economic analysis modelling study. Lancet Digit Health. 2020, 2(5): e240-e249. DOI: 10.1016/S2589-7500(20)30060-1.Xie Y, Nguyen QD, Hamzah H, et al. Artificial intelligence for teleophthalmology-based diabetic retinopathy screening in a national programme: an economic analysis modelling study. Lancet Digit Health. 2020, 2(5): e240-e249. DOI: 10.1016/S2589-7500(20)30060-1.
9、Lin S, Ma Y, Xu Y, et al. Artificial intelligence in community-based diabetic retinopathy telemedicine screening in urban China: cost-effectiveness and costutility analyses with real-world data. JMIR Public Health Surveill. 2023, 9: e41624. DOI: 10.2196/41624.Lin S, Ma Y, Xu Y, et al. Artificial intelligence in community-based diabetic retinopathy telemedicine screening in urban China: cost-effectiveness and costutility analyses with real-world data. JMIR Public Health Surveill. 2023, 9: e41624. DOI: 10.2196/41624.
10、Tufail A, Rudisill C, Egan C, et al. Automated diabetic retinopathy image assessment software: diagnostic accuracy and cost-effectiveness compared with human graders. Ophthalmology. 2017, 124(3): 343-351. DOI: 10.1016/j.ophtha.2016.11.014.Tufail A, Rudisill C, Egan C, et al. Automated diabetic retinopathy image assessment software: diagnostic accuracy and cost-effectiveness compared with human graders. Ophthalmology. 2017, 124(3): 343-351. DOI: 10.1016/j.ophtha.2016.11.014.
11、Li H, Li G, Li N, et al. Cost-effectiveness analysis of artificial intelligence-based diabetic retinopathy screening in rural China based on the Markov model. PLoS One. 2023, 18(11): e0291390. DOI: 10.1371/journal.pone.0291390.Li H, Li G, Li N, et al. Cost-effectiveness analysis of artificial intelligence-based diabetic retinopathy screening in rural China based on the Markov model. PLoS One. 2023, 18(11): e0291390. DOI: 10.1371/journal.pone.0291390.
12、Hu W, Joseph S, Li R, et al. Population impact and costeffectiveness of artificial intelligence-based diabetic retinopathy screening in people living with diabetes in Australia: a cost effectiveness analysis. EClinicalMedicine. 2024, 67: 102387. DOI: 10.1016/j.eclinm.2023.102387.Hu W, Joseph S, Li R, et al. Population impact and costeffectiveness of artificial intelligence-based diabetic retinopathy screening in people living with diabetes in Australia: a cost effectiveness analysis. EClinicalMedicine. 2024, 67: 102387. DOI: 10.1016/j.eclinm.2023.102387.
13、Fuller SD, Hu J, Liu JC, et al. Five-year cost-effectiveness modeling of primary care-based, nonmydriatic automated retinal image analysis screening among low-income patients with diabetes. J Diabetes Sci Technol. 2022, 16(2): 415-427. DOI: 10.1177/1932296820967011.Fuller SD, Hu J, Liu JC, et al. Five-year cost-effectiveness modeling of primary care-based, nonmydriatic automated retinal image analysis screening among low-income patients with diabetes. J Diabetes Sci Technol. 2022, 16(2): 415-427. DOI: 10.1177/1932296820967011.
14、Moher D, Shamseer L, Clarke M, et al. Preferred reporting items for systematic review and meta-analysis protocols (PRISMA-P) 2015 statement. Syst Rev. 2015, 4(1): 1. DOI: 10.1186/2046-4053-4-1.Moher D, Shamseer L, Clarke M, et al. Preferred reporting items for systematic review and meta-analysis protocols (PRISMA-P) 2015 statement. Syst Rev. 2015, 4(1): 1. DOI: 10.1186/2046-4053-4-1.
15、Husereau D, Drummond M, Petrou S, et al. Consolidated health economic evaluation reporting standards (CHEERS) statement. BMC Med. 2013, 11: 80. DOI: 10.1186/1741- 7015-11-80.Husereau D, Drummond M, Petrou S, et al. Consolidated health economic evaluation reporting standards (CHEERS) statement. BMC Med. 2013, 11: 80. DOI: 10.1186/1741- 7015-11-80.
16、Husereau D, Drummond M, Petrou S, et al. Consolidated health economic evaluation reporting standards (CHEERS): explanation and elaboration: a report of the ISPOR health economic evaluation publication guidelines good reporting practices task force. Value Health. 2013, 16(2): 231-250. DOI: 10.1016/j.jval.2013.02.002.Husereau D, Drummond M, Petrou S, et al. Consolidated health economic evaluation reporting standards (CHEERS): explanation and elaboration: a report of the ISPOR health economic evaluation publication guidelines good reporting practices task force. Value Health. 2013, 16(2): 231-250. DOI: 10.1016/j.jval.2013.02.002.
17、Craig D, Rice S. NHS economic evaluation database handbook. Centre for Reviews and Dissemination, University of York. 2007.Craig D, Rice S. NHS economic evaluation database handbook. Centre for Reviews and Dissemination, University of York. 2007.
18、Akers%20J%2C%20Aguiar-Ib%C3%A1%C3%B1ez%20R%2C%20Baba-Akbari%20Sari%20A.%20Centre%20%0Afor%20Reviews%20and%20Dissemination%20(CRD)%E2%80%99s%20guidance%20for%20%0Aundertaking%20reviews%20in%20health%20care.%20Retrieved%20from%20York%20%0A(UK).%20https%3A%2F%2Fwww.york.ac.uk%2Fmedia%2Fcrd%2FSystematic_%0AReviews%20pdf.2009.Akers%20J%2C%20Aguiar-Ib%C3%A1%C3%B1ez%20R%2C%20Baba-Akbari%20Sari%20A.%20Centre%20%0Afor%20Reviews%20and%20Dissemination%20(CRD)%E2%80%99s%20guidance%20for%20%0Aundertaking%20reviews%20in%20health%20care.%20Retrieved%20from%20York%20%0A(UK).%20https%3A%2F%2Fwww.york.ac.uk%2Fmedia%2Fcrd%2FSystematic_%0AReviews%20pdf.2009.
19、Zethraeus%20N%2C%20Johannesson%20M%2C%20J%C3%B6nsson%20B%2C%20et%20al.%20Advantages%20%0Aof%20using%20the%20net-benefit%20approach%20for%20analysing%20uncertainty%20%0Ain%20economic%20evaluation%20studies.%20Pharmacoeconomics.%202003%2C%20%0A21(1)%3A%2039-48.%20DOI%3A%2010.2165%2F00019053-200321010-00003.Zethraeus%20N%2C%20Johannesson%20M%2C%20J%C3%B6nsson%20B%2C%20et%20al.%20Advantages%20%0Aof%20using%20the%20net-benefit%20approach%20for%20analysing%20uncertainty%20%0Ain%20economic%20evaluation%20studies.%20Pharmacoeconomics.%202003%2C%20%0A21(1)%3A%2039-48.%20DOI%3A%2010.2165%2F00019053-200321010-00003.
20、Crespo C, Monleon A, Díaz W, et al. Comparative efficiency research (COMER): meta-analysis of costeffectiveness studies. BMC Med Res Methodol. 2014, 14: 139. DOI: 10.1186/1471-2288-14-139.Crespo C, Monleon A, Díaz W, et al. Comparative efficiency research (COMER): meta-analysis of costeffectiveness studies. BMC Med Res Methodol. 2014, 14: 139. DOI: 10.1186/1471-2288-14-139.
21、Willan AR. Incremental net benefit in the analysis of economic data from clinical trials, with application to the CADET-Hp trial. Eur J Gastroenterol Hepatol. 2004, 16(6): 543-549. DOI: 10.1097/00042737-200406000-00006.Willan AR. Incremental net benefit in the analysis of economic data from clinical trials, with application to the CADET-Hp trial. Eur J Gastroenterol Hepatol. 2004, 16(6): 543-549. DOI: 10.1097/00042737-200406000-00006.
22、Chaisai C, Patikorn C, Thavorn K, et al. Incremental net monetary benefit of using varenicline for smoking cessation: a systematic review and meta-analysis of economic evaluation studies. Addiction. 2024, 119(7): 1188-1202. DOI: 10.1111/add.16464.Chaisai C, Patikorn C, Thavorn K, et al. Incremental net monetary benefit of using varenicline for smoking cessation: a systematic review and meta-analysis of economic evaluation studies. Addiction. 2024, 119(7): 1188-1202. DOI: 10.1111/add.16464.
23、DerSimonian R, Laird N. Meta-analysis in clinical trials revisited. Contemp Clin Trials. 2015, 45(Pt A): 139-145. DOI: 10.1016/j.cct.2015.09.002.DerSimonian R, Laird N. Meta-analysis in clinical trials revisited. Contemp Clin Trials. 2015, 45(Pt A): 139-145. DOI: 10.1016/j.cct.2015.09.002.
24、Srisubat A, Kittrongsiri K, Sangroongruangsri S, et al. Cost-utility analysis of deep learning and trained human graders for diabetic retinopathy screening in a nationwide program. Ophthalmol Ther. 2023, 12(2): 1339-1357. DOI: 10.1007/s40123-023-00688-y.Srisubat A, Kittrongsiri K, Sangroongruangsri S, et al. Cost-utility analysis of deep learning and trained human graders for diabetic retinopathy screening in a nationwide program. Ophthalmol Ther. 2023, 12(2): 1339-1357. DOI: 10.1007/s40123-023-00688-y.
25、Huang XM, Yang BF, Zheng WL, et al. Cost-effectiveness of artificial intelligence screening for diabetic retinopathy in rural China. BMC Health Serv Res. 2022, 22(1): 260. DOI: 10.1186/s12913-022-07655-6.Huang XM, Yang BF, Zheng WL, et al. Cost-effectiveness of artificial intelligence screening for diabetic retinopathy in rural China. BMC Health Serv Res. 2022, 22(1): 260. DOI: 10.1186/s12913-022-07655-6.
26、Li H, Zheng Y, Xie P, Ng TK, Qiu K, Zhang G. Costeffectiveness analysis of telemedicine and artificial intelligence-based diabetic retinopathy screening in urban and rural China. 2023.PLoS One. 2023 Nov 16;18(11):e0291390. DOI: 10.1371/journal.pone.0291390.Li H, Zheng Y, Xie P, Ng TK, Qiu K, Zhang G. Costeffectiveness analysis of telemedicine and artificial intelligence-based diabetic retinopathy screening in urban and rural China. 2023.PLoS One. 2023 Nov 16;18(11):e0291390. DOI: 10.1371/journal.pone.0291390.
27、Chawla H, Uhr JH, Williams JS, et al. Economic evaluation of artificial intelligence systems versus manual screening for diabetic retinopathy in the United States. Ophthalmic Surg Lasers Imaging Retina. 2023, 54(5): 272- 280. DOI: 10.3928/23258160-20230406-01.Chawla H, Uhr JH, Williams JS, et al. Economic evaluation of artificial intelligence systems versus manual screening for diabetic retinopathy in the United States. Ophthalmic Surg Lasers Imaging Retina. 2023, 54(5): 272- 280. DOI: 10.3928/23258160-20230406-01.
28、Gomez Rossi J, Rojas-Perilla N, Krois J, et al. Costeffectiveness of artificial intelligence as a decision-support system applied to the detection and grading of melanoma, dental caries, and diabetic retinopathy. JAMA Netw Open. 2022, 5(3): e220269. DOI: 10.1001/ jamanetworkopen.2022.0269.Gomez Rossi J, Rojas-Perilla N, Krois J, et al. Costeffectiveness of artificial intelligence as a decision-support system applied to the detection and grading of melanoma, dental caries, and diabetic retinopathy. JAMA Netw Open. 2022, 5(3): e220269. DOI: 10.1001/ jamanetworkopen.2022.0269.
29、Curran K, Piyasena P, Congdon N, et al. Inclusion of diabetic retinopathy screening strategies in nationallevel diabetes care planning in low- and middle-income countries: a scoping review. Health Res Policy Syst. 2023, 21(1): 2. DOI: 10.1186/s12961-022-00940-0.Curran K, Piyasena P, Congdon N, et al. Inclusion of diabetic retinopathy screening strategies in nationallevel diabetes care planning in low- and middle-income countries: a scoping review. Health Res Policy Syst. 2023, 21(1): 2. DOI: 10.1186/s12961-022-00940-0.
30、Wolf RM, Channa R, Abramoff MD, et al. Costeffectiveness of autonomous point-of-care diabetic retinopathy screening for pediatric patients with diabetes. JAMA Ophthalmol. 2020, 138(10): 1063-1069. DOI: 10.1001/jamaophthalmol.2020.3190.Wolf RM, Channa R, Abramoff MD, et al. Costeffectiveness of autonomous point-of-care diabetic retinopathy screening for pediatric patients with diabetes. JAMA Ophthalmol. 2020, 138(10): 1063-1069. DOI: 10.1001/jamaophthalmol.2020.3190.
31、Scotland GS, McNamee P, Philip S, et al. Costeffectiveness of implementing automated grading within the national screening programme for diabetic retinopathy in Scotland. Br J Ophthalmol. 2007, 91(11): 1518-1523. DOI: 10.1136/bjo.2007.120972.Scotland GS, McNamee P, Philip S, et al. Costeffectiveness of implementing automated grading within the national screening programme for diabetic retinopathy in Scotland. Br J Ophthalmol. 2007, 91(11): 1518-1523. DOI: 10.1136/bjo.2007.120972.
32、Wang Y, Liu C, Hu W, et al. Economic evaluation for medical artificial intelligence: accuracy vs. costeffectiveness in a diabetic retinopathy screening case. NPJ Digit Med. 2024, 7(1): 43. DOI: 10.1038/s41746-024- 01032-9.Wang Y, Liu C, Hu W, et al. Economic evaluation for medical artificial intelligence: accuracy vs. costeffectiveness in a diabetic retinopathy screening case. NPJ Digit Med. 2024, 7(1): 43. DOI: 10.1038/s41746-024- 01032-9.
33、Liu J, Gibson E, Ramchal S, et al. Diabetic retinopathy screening with automated retinal image analysis in a primary care setting improves adherence to ophthalmic care. Ophthalmol Retina. 2021, 5(1): 71-77. DOI: 10.1016/ j.oret.2020.06.016.Liu J, Gibson E, Ramchal S, et al. Diabetic retinopathy screening with automated retinal image analysis in a primary care setting improves adherence to ophthalmic care. Ophthalmol Retina. 2021, 5(1): 71-77. DOI: 10.1016/ j.oret.2020.06.016.
上一篇
下一篇
目录

点击右上角菜单,浏览器打开下载

我知道了