您的位置: 首页 > 2024年9月 第1卷 第3期 > 文字全文
2023年7月 第38卷 第7期11
目录

Machine learning methods for biological age estimation

Machine learning methods for biological age estimation

来源期刊: Eye Science | 2024年9月 第1卷 第3期 176-189 发布时间:2024-09-14 收稿时间:2024/11/12 9:51:28 阅读量:414
作者:
关键词:
machine learning biological age aging research
DOI:
10.12419/es24073003
Received date:
2024-07-30 
Accepted date:
2024-08-25 
Published online:
2024-09-14 
Age stands as a primary risk factor for diseases and disabilities among the elderly. To effectively assess the underlying aging processes, accurate measures of biological age and rates of aging across multiple levels of aging features are essential. Biological age derives from physiological assessments of systems and organs. It has emerged as a superior predictor of age-related diseases and mortality compared to chronological age. Recent advancements in machine learning have catalyzed the development of sophisticated models capable of quantitatively characterizing biological aging with different types of data. This review explores the machine learning models in advancing our understanding of biological aging, highlighting the potential of these innovative approaches to facilitate aging research and personalized healthcare strategies.
Age stands as a primary risk factor for diseases and disabilities among the elderly. To effectively assess the underlying aging processes, accurate measures of biological age and rates of aging across multiple levels of aging features are essential. Biological age derives from physiological assessments of systems and organs. It has emerged as a superior predictor of age-related diseases and mortality compared to chronological age. Recent advancements in machine learning have catalyzed the development of sophisticated models capable of quantitatively characterizing biological aging with different types of data. This review explores the machine learning models in advancing our understanding of biological aging, highlighting the potential of these innovative approaches to facilitate aging research and personalized healthcare strategies.

HIGHLIGHTS

Recent advancements in machine learning have catalyzed the development of sophisticated models capable of quantitatively characterizing biological aging with different types of data.

Cover various types of machine learning models, examine the role of omics data, explore tissue-based indicators, and analyze composite measures of biological age.

The biological aging is affected by many comprehensive factors and constructing machine learning models for biological age estimation is useful to comprehensively assess and monitor the aging state of the body.

INTRODUCTION

Biological age (BA), a measure derived from the physiological condition of an individual’s systems and organs, represents a comprehensive assessment of aging. It surpasses chronological age in its predictive ability for age-related diseases and mortality risks. Compared to chronological age, which simply counts the passage of time since birth, BA integrates complex factors such as genetic predisposition, environmental influences, and lifestyle choices that collectively influence the aging trajectory.[1] It has been widely hypothesized that the estimated age using these complex factors can effectively measure an individual’s biological age. The difference between estimated age and chronological age is referred  to as the “age gap”. Individuals with positive age gaps face accelerated aging and are at higher risk of mortality and are more susceptible to age-related diseases. Numerous studies have demonstrated that BA serves as a robust predictor of diseases such as cardiovascular ailments and diabetes, highlighting its potential to reflect the cumulative impacts of these diverse factors on an individual’s health span.[2-3] Therefore, BA can be utilized as a quantitative indicator to accurately assess individuals’ levels of functional status, facilitating implement of early health interventions and reduction of the disease burden.

BA is a complex process driven by the interactions of countless molecules and various biological mechanisms. Identifying molecular biomarkers and other factors that reflect biological age not only enhances our understanding of aging’s underlying mechanisms but also provides drug targets for addressing age-related diseases. Furthermore, integrating multiple factors and developing explainable prediction models of biological age offer personalized insights into an individual’s aging process, guiding tailored interventions and treatments, such as medication and lifestyle changes. As the global population ages, the prevalence of age-related diseases and mortality rates have risen significantly. This personalized healthcare approach promotes early detection and intervention, leading to more precise treatments and a reduction in the overall disease burden.

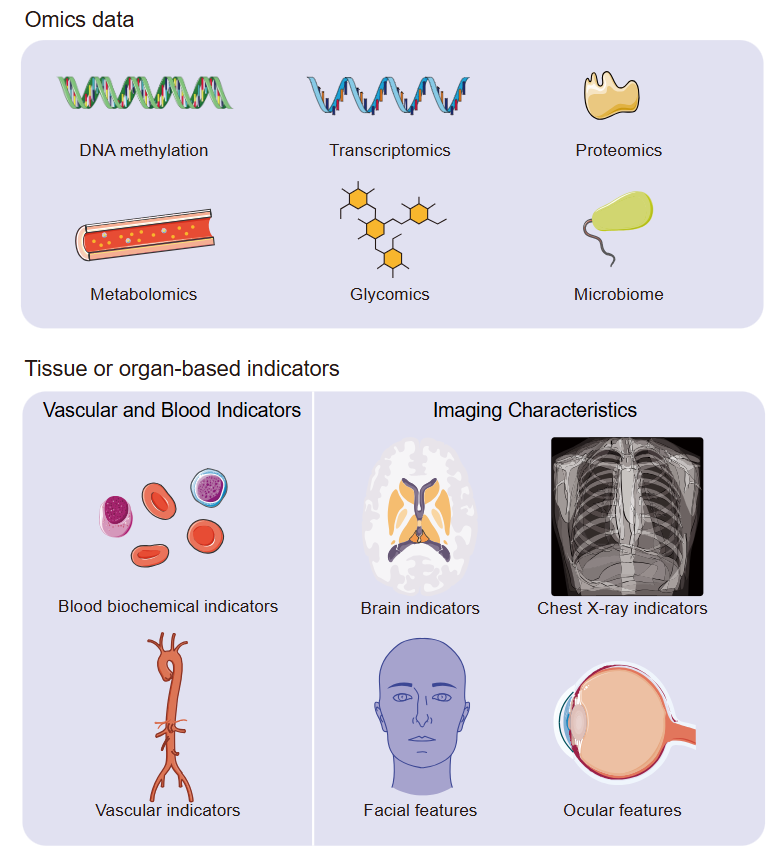
To find the optimized methods to evaluate BA is one of the important research branches in current aging study area. Recent advances have seen the emergence of machine learning (ML) as a transformative tool in this domain, capable of discerning intricate patterns within extensive datasets to estimate biological age with unprecedented accuracy. While traditional methods like blood pressure or invasive blood test for measuring telomere length provide important insights into assessing biological age, their limitations in invasiveness and dimensionality hinder their effectiveness. ML, with its ability to integrate diverse data and uncover complex relationships, presents a more accurate and efficient alternative for understanding biological aging. This shift not only enhances the ability to assess aging but also holds promise for advancing personalized health interventions and improving outcomes across populations. ML techniques leverage computational algorithms that autonomously learn from large-scale data, enabling the identification of subtle biomarkers and aging signatures that traditional methods may overlook.[4] By harnessing the power of ML, researchers can develop models that not only estimate BA but also unravel the underlying biological mechanisms driving aging processes. This review critically evaluates the current state of research into ML-driven approaches for BA estimation (Table 1), underscoring their significant potential to enhance our understanding of the aging process and to revolutionize personalized healthcare strategies (Figure 1 and Table 2-4). In doing so, the paper will comprehensively cover various types of ML models, examine the role of omics data, explore tissue-based indicators, and analyze composite measures of BA, providing a holistic view of the advancements in this rapidly evolving field.

Figure 1 The types of biological age estimation using machine learning methods

Table 1. The overview of different ML methods

ML method

Definition

Applicable Data Types

Strengths

Linear regression

A statistical method used to model the relationship between a dependent variable and one or more independent variables by fitting a linear equation to observed data

Numerical, structured data

Simple to implement and interpret.

Efficient for linear relationships.

Works well with small datasets.

Support vector machines (SVM)

Supervised learning models used for classification and regression tasks and work by finding the optimal hyperplane that separates data points of different classes with the maximum margin

Numerical, categorical, text

Effective in high-dimensional spaces.

Robust against overfitting with appropriate kernels.

Good for binary classification tasks.

Decision trees

A supervised learning algorithm used for classification and regression tasks and the model decisions and possible consequences in a tree-like structure, where each internal node represents a feature or attribute, each branch represents a decision rule, and each leaf node represents an outcome or class label.

Numerical, categorical

Intuitive and easy to interpret.

Good for feature selection.

Neural networks

A class of machine learning models inspired by the structure and function of the human brain and consist of interconnected layers of nodes that process and transform input data. Each connection has an associated weight, which adjusts as the network learns from training data.

Numerical, image, text

Captures complex non-linear relationships.

Can handle large datasets and multiple features.

Flexible architecture allows for various applications.

Deep neural networks (DNNs)

A type of artificial neural network characterized by multiple layers of neurons between the input and output layers. This architecture allows DNNs to learn complex representations and patterns in data and the depth of the network enables it to capture intricate features and hierarchies in the data.

Numerical, image, text, audio

Highly effective for complex patterns and large datasets.

Can integrate various data types effectively.


Table 2. Machine Learning Combined with Omics Data for Biological Age Assessment

Research

Type of data

Source

Age group(years)

Bocklandt S., et al. [19]

DNA methylation

Saliva

18-70

Hannum G., et al. [13]

DNA methylation

Whole blood

19-101

Zhang, Y., et al. [17]

DNA methylation

Whole blood

31-82

Levine M.E., et al. [15]

DNA methylation

Blood cell

21-100

Hillary, R.F., et al. [23]

DNA methylation

Whole blood

11-70

Peters, M.J., et al. [24]

RNA-seq

Whole blood

≥20

Fleischer, J.G., et al. [25]

RNA-seq

Human skin

1-94

Holzscheck, N., et al. [26]

RNA-seq

Epidermal skin

30-89

Ignjatovic, V., et al. [27]

Proteome

Plasma

Day 1 and Day 3 neonates, <1-16; 21-43

Baird, G.S., et al. [28]

Proteome

Cerebrospinal fluid

21-85

Menni, C., et al. [29]

Proteome

Blood

39-83

Tanaka, T., et al. [30]

Proteome

Plasma

22-93

Lehallier, B., et al. [31]

Proteome

Plasma

18-95

Wolf J, et al. [32]

Proteome

Aqueous humor and vitreous liquid

22-90

Deelen, J., et al. [33]

Metabolome

Plasma and serum

18-109

Van Den Akker, E.B., et al. [34]


Metabolome

Serum

18-85

Robinson, O., et al. [35]

Metabolome

Urine and serum

19.2–65.2

Hertel, J., et al. [36]

Metabolome

Urine

20-79

Krištić, J., et al. [37]

IgG glycosylation

Plasma

17-100

Galkin, F., et al. [38]

Microbiome

Gut

20-90


Table 3 Machine learning combined with tissue or organ-based indicators for biological age assessment

Research

Type of data

Source

Age group(years)

Putin, E., et al. [39]

Blood biochemical indicators

Blood

2-100

Mamoshina, P., et al. [40]

Blood biochemical indicators

Blood

20-90

Mamoshina, P., et al. [41]

Blood biochemical indicators

Blood

26-81

Liu, Z., et al. [42]

Blood biochemical indicators

Blood

20-85

Cole, J.H., et al. [44]

neuroimaging

Brain

18-90

Elliott, M.L., et al. [45]

High resolution structural images using a T1-weighted MP-RAGE

Brain

24-72

McClelland, R.L., et al. [47]

Coronary artery calcium

Coronary artery

45-84

Nilsson Wadström, B., et al. [48]

aortic pulse wave velocity (aPWV) and carotid intima–media thickness (cIMT)

Aortic and carotid artery

45-64

Gale, C.R., et al. [49]


60

Raghu, V.K., et al. [50]

Chest radiograph image

Chest X-ray

40-100

Christensen, K., et al. [51]

Facial photograph

Face

70-99

Xia, X., et al. [52]

Three-dimensional facial images

Face

<30->80

Yu, Z., et al. [53]

Facial image

Face

20–90

Zhu, Z., et al. [54]

Fundus image

Fundus

40-69

Hu, W., et al. [55]

Fundus image

Fundus

40-69

Nusinovici, S., et al. [56]

Retinal photos

Fundus

65

Liu C., et al. [57]

Retinal photos

Fundus

50

Ruiyang Li, et al. [58]

Lens photographs

Lens

20-96

OVERVIEW OF ML METHODS APPLIED TO BA ESTIMATION

Aging clocks are ML models used to measure the biological aging state of the body, structured by combining various types of clinical data with ML algorithms. ML is able to estimate one’s age, using data of aging features as input and an estimated age value as output. The advantage of ML is that it enables computers to analyze large sample data features and make corresponding inferences in a short time.[5] The most commonly used model is linear regression model which generates an optimal fitting line or plane of multidimensional data by calculating parameters of aging data. For complex high-dimensional omics data, penalized linear regression models, such as Lasso regression using L1 regularization,[6] Ridge regression using L2 regularization,[7] and Elastic Net regression,[8] are widely employed to reduce the number of features and enhance the correlations between features. In addition, there are other common ML methods, including support vector machines,[9] decision trees,[10] and neural networks.[11] What’s more, for large sample data, deep neural network shows optimal performance in various fields,[12] which can learn more complex nonlinear relationships from data by connecting numerous nodes. The difference between the estimated age with the chronological age is served as the indicator to evaluate the individual’s aging rate. It is widely acknowledged that individuals with a positive difference are aging faster than their peers, while those with a negative difference are aging slower.[13-14] Additionally, it has been confirmed that higher risks of age-related events occur among individuals with positive difference.[15-17]

ML COMBINED WITH OMICS DATA FOR BA ESTIMATION

DNA methylation data for BA assessment

Epigenetic change is a hallmark of aging and DNA methylation is a widely recognized indicator to assess BA,[18] mainly manifesting by an increase or decrease of CpG methylation. Bocklandt et al. built the first methylation clock based on 100 saliva samples using elastic net model in 2011, which predicts CA with an error within 5 years.[19] The concept of the ‘epigenetic aging clock’ was proposed by Hannum et al. in 2013 using DNA methylation data from 71 CpG sites[13] and then Horvath further analyzed whole-genome DNA methylation data, containing 353 CpG sites, to develop a BA estimation model.[13]

Methylation predictive model has been further investigated the correlation with mortality. Zhang et al. utilized Lasso Cox regression to determine 10 CpG sites highly associated with mortality.[17] What’s more, DNAm PhenoAge clock was established by Levine et al. combined chronological age with 9 clinical indicators associated with mortality.[15] Other ML models have shown strong association with mortality and multiple age-related functional decline, including heart disease, cognitive and physical failure.[20-23]

Transcriptomics data for BA assessment

Using RNA gene expression to establish aging clocks can link aging with genes, enhancing the ML model’s interpretability and experimental testability. Peters et al. trained a ML model based on peripheral blood mononuclear cells gene expression data from multiple large cohorts in 2015, first to explore the transcriptomics clock.[24] In 2018, Fleischer et al. established a model using human skin fibroblast transcriptomics data.[25] In 2021, Holzscheck et al. developed a transcriptomics age prediction model using deep neural networks and reported its correlation with skin aging measured by various methods.[26] However, age prediction accuracy of transcriptomics clocks varied significantly across cohorts, possibly due to noise of microarray and sequencing data from different platforms.

Proteomics data for BA assessment

Studies demonstrate that composition and quantity of thousands of proteins varying with age in human plasma and cerebrospinal fluid.[27-28] Consequently, it’s feasible to evaluate BA by establishing an age-related protein expression pattern. Baird et al. and Menni et al. developed the earliest proteomics aging clocks.[28-29] In 2018, Tanaka et al. explored the correlation between plasma proteins and biological aging and filtered out 76 proteins to develop the BA model.[30] In 2019, Lehallier et al. developed a ML model evaluating age accurately across multiple independent cohorts based on 373 plasma proteins and found three significant peaks in quantities of plasma protein at 34, 60, and 78 years old, indicating the nonlinear process of aging and phased changes of aging features.[31] Furthermore, an artificial intelligence (AI) model of prediction of the eye aging based on aqueous humor liquid biopsy proteomics was developed by Wolf et al.[32]

Metabolomics data for BA assessment

A large-scale study used plasma nuclear magnetic resonance analysis to identify metabolites predicting mortality,[33] which demonstrated that multiple metabolites, including albumin, very low-density lipoprotein and amino acids, were correlated with multi-caused death. Another study developed a metabolomics clock based on 56 plasma metabolites and further explored the association between metabolic age differences and cardiovascular phenotypes or mortality.[34] In this study, accelerated metabolic age was found to be associated with cardiovascular risk factors, cardiovascular disease risk, and all-cause mortality. Moreover, other metabolomics predictive models constructed from plasma and urine metabolites, using multi-targeted and untargeted mass spectrometry and nuclear magnetic resonance methods, were further validated to be related to risk factors for diseases, such as hypertension, diabetes, and obesity.[35-36]

Other omics data for BA assessment

Furthermore, other omics data including glycomics and microbiome data have been used for BA model development. For example, Krištić et al. predicted age in multiple European cohorts using N-glycosylation patterns of serum IgG proteins,[37] and Galkin et al. predicted age from the taxonomic composition of the gut microbiome using deep neural networks.[38]

ML COMBINED WITH TISSUE OR ORGAN-BASED INDICATORS FOR BA ASSESSMENT

Blood biochemical indicators

Many blood biochemical biomarkers correspondingly changing with age can assess the health and disease status. Putin et al. develop a ML model using 46 indicators, including albumin and alkaline phosphatase, from 62,419 patients.[39] Another ML model was constructed based on 19 blood biochemical indicators, including albumin and urea, along with gender and race, from 142,379 individuals across multiple countries, which was validated in 55,751 individuals from the National Health and Nutrition Examination Survey (NHANES) database.[40] This research indicated a positive correlation between blood biochemical age and all-cause mortality. Combining 23 blood biochemical indicators, including glycosylated hemoglobin and urea, with gender and lifestyle factors like smoking in 149,000 Canadians, Mamoshina et al. developed a ML model and suggested that lifestyle potentially affects an individual’s aging status and BA.[41] What’s more, Levine et al. established a model based on multiple indicators of 9926 individuals from NHANES III database, including albumin, alkaline phosphatase, and chronological age.[15] Based on the NHANES IV database, Liu et al. showed that the predicted age by BA model has high accuracy in predicting all-cause mortality and disease-specific mortality in populations.[42]

Brain indicators

Brain tissue has gradually characteristic changes during aging, and some researches indicate that the aging process of brain is consistent with cognitive decline. Brain aging is associated with increasing risks of neurodegenerative diseases and dementia.[43] Cole et al. established a model evaluating brain aging levels using T1-weighted MRI from 2,001 healthy individuals, suggesting that increasing brain age correlates with mortality and gradual decline of cognitive and respiratory functions.[44] Similar correlation between the increased brain age and cognition impairment was demonstrated by Elliott et al.[45]

Vascular indicators

Vascular tissues also exhibit characteristic changes during aging, such as decreased elasticity and increased stiffness of blood vessel walls. In addition, the incidence of diseases such as carotid artery stenosis and vascular embolism is also increasing during aging.[46] McClelland et al. established an arterial age model based on coronary artery calcification scores and this model accurately predicted the risk of coronary heart disease.[47] Nilsson et al. used aortic pulse wave velocity and carotid intima-media thickness to evaluate vascular aging, revealing a positive correlation with cardiovascular disease and frailty risks.[48] Gale et al. also shows the similar correlations between cardiovascular disease risks and frailty.[49]

Chest X-ray indicators

Based on Chest X-ray from 116,035 individuals, Raghu et al. constructed a chest X-ray age prediction model and validated its performance in two validation sets.[50] In this research, the first stage used chest X-ray images from 24,934 individuals from CheXpert, National Institutes of Health Chest X-ray 14, and PadCHEST cohorts to develop a deep learning model predicting chronological age. The second stage fine-tuned the model using chest X-ray images with time to death as labels, from 13,657 individuals from 25% PLCO (Prostate, Lung, Colorectal, and Ovarian Cancer Screening Trial) cohort to construct the final model of BA assessment and validated in 75% populations of PLCO and NLST (National Lung Screening Trial) cohorts. The results suggested that chest X-ray age better reflected risks of all-cause mortality and cardiovascular disease mortality than chronological age.

Facial features

Clinicians estimate patients’ age and health status based on facial features.[49] Christensen et al. revealed that increased perceived age was correlated with reduced physical activity, cognitive function, and telomere length by following 1,826 twins over 70 for seven years.[51] In 2020, Xia et al. captured facial features from 3D images of 4,719 Chinese individuals to develop deep neural networks to assess facial age.[52] The facial age was highly related with actual chronological age and the difference between predicted perceived age and chronological age had high association with obesity and blood pressure.[52] This research indicated that altering unhealthy living habits might slow down the biological aging level. In addition, based on the age dependency of facial temperature, Yu et al. collected facial images of 2,811 Han Chinese individuals 20–90 years old and developed the age and disease prediction models.[53] The difference between predicted age in this study and chronological age is associated with metabolic parameters, sleep time, gene expression pathways and exercise.

Ocular features

For ocular features, researchers have constructed age prediction models using retinal images or lens images. Based on the UK Biobank public database, researchers developed different models. Zhu et al. built a machine learning-based retinal age prediction model using 80,169 retinal images from 46,969 individuals, uncovering that the difference between retinal age and chronological age was correlated with increased risk of all-cause mortality and specific-cause mortality.[54] Hu et al. constructed another retinal age predictive model based on 19,200 retinal images from 46,969 individuals and retinal age differences created by trained deep learning model from 35,834 participants.[55] This research presented that each year increase in the retinal age difference increased Parkinson’s disease risk by 10% and the risk of Parkinson’s disease was significantly increased at the third and fourth quartiles of retinal age difference compared to the lowest quartile. ‘RetiAGE’, the probability of being ≥65 years old predicted by a deep learning model trained by 129,236 retinal images from 40,480 participants, analyzed 56,301 participants in UK Biobank cohort, turning out that individuals in the fourth quartile of RetiAGE had a 67% increased 10-year all-cause mortality risk and 39% increased risks of cardiovascular disease and cancer, compared to those in the first quartile.[56] Liu et al. developed a CNN-based BA assessment model using 12000 fundus images from healthy individuals.[57] Based on the aging characteristics of the lens, Li et al. utilized slit lamp-captured lens images from the Chinese population to develop the “LensAge” model. This model predicts age-related diseases and mortality. Moreover, the “LensAge” model shows promise for application in smartphone-based self-assessment of aging, introducing innovative modes of measuring aging.[58]

ML COMBINED WITH COMPOSITE INDICATORS FOR BA ASSESSMENT

Different individuals age at different rates, and different tissues and organs within the same individual also age at various rates. Most BA estimation models, developed by the above methods, are based on single kind of omics data or single tissue or organ and vary their sensitivities of different aging indicators, reflecting different aspects of aging or specific parts aging levels due to the close relationship between organ aging with diseases of specific parts. Comprehensive assessment of individual aging levels can be achieved by constructing aging models combining multiple indicators. Levine et al. developed a model combining multiple system indicators, including blood pressure, lung capacity indicators and blood biochemical indicators.[2] Li et al. combined 37 indicators reflecting multiple functions of the body and calculated system homeostasis imbalance scores which increased during aging and could predict the incidence of age-related events, such as death and diabetes.[59] Furthermore, Belskey et al. suggested a higher association between composite indicators and health outcomes.[60]

CONCLUSIONS

At present, although many researches combing machine learning with multiple data have been reported, there is still a lack of a recognized gold standard for BA. Different types of BA models reflect different aging indicators, and different degrees of noise exist in the measurement of omics data or system organ parameters. To make these models better reflect the actual complex aging state, more indicators and aspects should be considered. For example, the utilized data should combine multi-omics aging indicators and incorporate aging features of multiple organs. Furthermore, the influence of lifestyle and environmental exposure matters may affect the process and outcomes of aging, such as physical activity and dietary factors. More importantly, large-scale longitudinal cohort data will improve the predictive performance of the occurrence age-related events though aging indicators. Therefore, the study should not limited to cross-sectional design. With the continuous expansion of data dimensions and sample sizes, it is difficult for traditional statistical methods and algorithms to fit higher-dimensional features and select meaningful aging indicators. The selection of analysis methods and deep learning algorithms using big data according to the research goals and needs is also necessary to improve the performance of BA estimation models. In addition, more convenient and accurate BA methods need to be further explored. Future directions in biological age assessments should emphasize a deeper understanding of aging processes and their underlying mechanisms, the development of a more accurate and accessible model for real-world applications, and the inclusion of larger population samples to create a more robust and generalized biological age model.

However, measuring biological age presents several challenges, including data availability, ethical considerations, and clinical implementation. Data availability is often limited due to fragmented datasets and difficulties in obtaining large sample sizes necessary for robust analyses. Ethical considerations are critical, as handling sensitive genetic and health data raises privacy concerns and necessitates clear informed consent processes. What’s more, clinical implementation faces a translational gap, as many potential biomarkers require rigorous validation before widespread adoption. To address these challenges, promoting open-access database with standardized protocols and implementing data protection policies and anonymization techniques may beneficial for data availability and privacy considerations. Additionally, conducting longitudinal studies can enhance accuracy, while initiating pilot programs in clinical settings will facilitate practical applications in real world.

The biological aging is affected by many comprehensive factors. Constructing BA ML models is useful to monitor the aging state of the body in real time, and deeply explore the molecular regulatory mechanism related to aging, which is expected to find targets for delaying aging, hence to prevent the occurrence and development of age-related diseases.

Correction notice

None

Acknowledgement

None

Author Contributions

(Ⅰ) Conception and design: Haotian Lin
(Ⅱ) Administrative support: Haotian Lin
(Ⅲ) Provision of study materials or patients: Ruiyang Li and Wenben Chen
(Ⅳ) Collection and assembly of data: Ruiyang Li, Wenben Chen, and Jialing Chen
(Ⅴ) Data analysis and interpretation: Ruiyang Li, Wenben Chen, and Jialing Chen
(Ⅵ) Manuscript writing: All authors
(Ⅶ) Final approval of manuscript: All authors

Fundings

This work was supported by the National Natural Science Foundation of China (82171035, 82301266), the High-level Science and Technology Journals Projects of Guangdong Province (2021B1212010003), Guangdong Basic and Applied Basic Research Foundation (2024A1515012001), China Postdoctoral Science Foundation (2023M744033), the Postdoctoral Fellowship Program of CPSF (GZB20230896), and Basic scientific research projects of Sun Yat-sen University (23ykcxqt002). The funders had no role in the study design, data collection and analysis, decision to publish, or preparation of the manuscript.

Conflict of Interests

None of the authors has any conflicts of interest to disclose. All authors have declared in the completed the ICMJE uniform disclosure form.

Patient consent for publication

None

Ethical Statement

None

Provenance and Peer Review

This article was a standard submission to our journal. The article has undergone peer review with our anonymous review system.

Data Sharing Statement

None

Open Access Statement

This is an Open Access article distributed in accordance with the Creative Commons AttributionNonCommercial-NoDerivs 4.0 International License (CC BY-NC-ND 4.0), which permits the non-commercial replication and distribution of the article with the strict proviso that no changes or edits are made and the original work is properly cited (including links to both the formal publication through the relevant DOI and the license).
1、Hamczyk MR, Nevado RM, Barettino A, et al. Biological versus chronological aging: JACC focus seminar. J Am Coll Cardiol. 2020, 75(8): 919-930. DOI: 10.1016/ j.jacc.2019.11.062.Hamczyk MR, Nevado RM, Barettino A, et al. Biological versus chronological aging: JACC focus seminar. J Am Coll Cardiol. 2020, 75(8): 919-930. DOI: 10.1016/ j.jacc.2019.11.062.
2、Levine%20ME.%20Modeling%20the%20rate%20of%20senescence%3A%20can%0Aestimated%20biological%20age%20predict%20mortality%20more%20accurately%20%0Athan%20chronological%20age%3F%20J%20Gerontol%20A%20Biol%20Sci%20Med%20Sci.%0A2013%2C%2068(6)%3A%20667-674.%20DOI%3A%2010.1093%2Fgerona%2Fgls233.Levine%20ME.%20Modeling%20the%20rate%20of%20senescence%3A%20can%0Aestimated%20biological%20age%20predict%20mortality%20more%20accurately%20%0Athan%20chronological%20age%3F%20J%20Gerontol%20A%20Biol%20Sci%20Med%20Sci.%0A2013%2C%2068(6)%3A%20667-674.%20DOI%3A%2010.1093%2Fgerona%2Fgls233.
3、Kang YG, Suh E, Lee JW, et al. Biological age as a health index for mortality and major age-related disease incidence in Koreans: national Health Insurance Service - Health screening 11-year follow-up study. Clin Interv Aging. 2018, 13: 429-436. DOI: 10.2147/CIA.S157014.Kang YG, Suh E, Lee JW, et al. Biological age as a health index for mortality and major age-related disease incidence in Koreans: national Health Insurance Service - Health screening 11-year follow-up study. Clin Interv Aging. 2018, 13: 429-436. DOI: 10.2147/CIA.S157014.
4、Rutledge J, Oh H, Wyss-Coray T. Measuring biological age using omics data. Nat Rev Genet. 2022, 23(12): 715- 727. DOI: 10.1038/s41576-022-00511-7.Rutledge J, Oh H, Wyss-Coray T. Measuring biological age using omics data. Nat Rev Genet. 2022, 23(12): 715- 727. DOI: 10.1038/s41576-022-00511-7.
5、Hashmi S. ‘Coming of Age’ of artificial intelligence: evolution of survivorship care through information technology. Bone Marrow Transplant. 2016, 51(1): 41-42. DOI: 10.1038/bmt.2015.271.Hashmi S. ‘Coming of Age’ of artificial intelligence: evolution of survivorship care through information technology. Bone Marrow Transplant. 2016, 51(1): 41-42. DOI: 10.1038/bmt.2015.271.
6、Tibshirani R. Regression shrinkage and selection via the lasso. J R Stat Soc Ser B: Methodol. 1996, 58: 267-288. DOI: 10.1111/J.2517-6161.1996.TB02080.X.Tibshirani R. Regression shrinkage and selection via the lasso. J R Stat Soc Ser B: Methodol. 1996, 58: 267-288. DOI: 10.1111/J.2517-6161.1996.TB02080.X.
7、Hilt D, Seegrist DW. Ridge, a computer program for calculating ridge regression estimates.1977.Hilt D, Seegrist DW. Ridge, a computer program for calculating ridge regression estimates.1977.
8、Zou H, Hastie T. Regularization and variable selection via the elastic net. Journal of the Royal Statistical Society Series B: Statistical Methodology. 2005, 67(2): 301-320. DOI: 10.1111/biom.12868.Zou H, Hastie T. Regularization and variable selection via the elastic net. Journal of the Royal Statistical Society Series B: Statistical Methodology. 2005, 67(2): 301-320. DOI: 10.1111/biom.12868.
9、Platt J. Probabilistic outputs for support vector machines and comparisons to regularized likelihood methods. Advances in large margin classifiers. 1999, 10(3): 61-74.Platt J. Probabilistic outputs for support vector machines and comparisons to regularized likelihood methods. Advances in large margin classifiers. 1999, 10(3): 61-74.
10、Breiman L. Random forests. Machine learning. 2001, 45(1): 5-32.Breiman L. Random forests. Machine learning. 2001, 45(1): 5-32.
11、Hinton G E. Connectionist learning procedures//Machine learning. Morgan Kaufmann, 1990: 555-610.Hinton G E. Connectionist learning procedures//Machine learning. Morgan Kaufmann, 1990: 555-610.
12、Alzubaidi L, Zhang J, Humaidi AJ, et al. Review of deep learning: concepts, CNN architectures, challenges, applications, future directions. J Big Data. 2021, 8(1): 53. DOI: 10.1186/s40537-021-00444-8.Alzubaidi L, Zhang J, Humaidi AJ, et al. Review of deep learning: concepts, CNN architectures, challenges, applications, future directions. J Big Data. 2021, 8(1): 53. DOI: 10.1186/s40537-021-00444-8.
13、Hannum G, Guinney J, Zhao L, et al. Genome-wide methylation profiles reveal quantitative views of human aging rates. Mol Cell. 2013, 49(2): 359-367. DOI: 10.1016/j.molcel.2012.10.016.Hannum G, Guinney J, Zhao L, et al. Genome-wide methylation profiles reveal quantitative views of human aging rates. Mol Cell. 2013, 49(2): 359-367. DOI: 10.1016/j.molcel.2012.10.016.
14、Horvath S. DNA methylation age of human tissues and cell types. Genome Biol. 2013, 14(10): R115. DOI: 10.1186/ gb-2013-14-10-r115.Horvath S. DNA methylation age of human tissues and cell types. Genome Biol. 2013, 14(10): R115. DOI: 10.1186/ gb-2013-14-10-r115.
15、Levine ME, Lu AT, Quach A, et al. An epigenetic biomarker of aging for lifespan and healthspan. Aging. 2018, 10(4): 573-591. DOI: 10.18632/aging.101414.Levine ME, Lu AT, Quach A, et al. An epigenetic biomarker of aging for lifespan and healthspan. Aging. 2018, 10(4): 573-591. DOI: 10.18632/aging.101414.
16、Lu AT, Quach A, Wilson JG, et al. DNA methylation GrimAge strongly predicts lifespan and healthspan. Aging. 2019, 11(2): 303-327. DOI: 10.18632/aging.101684.Lu AT, Quach A, Wilson JG, et al. DNA methylation GrimAge strongly predicts lifespan and healthspan. Aging. 2019, 11(2): 303-327. DOI: 10.18632/aging.101684.
17、Zhang Y, Wilson R, Heiss J, et al. DNA methylation signatures in peripheral blood strongly predict all-cause mortality. Nat Commun. 2017, 8: 14617. DOI: 10.1038/ ncomms14617.Zhang Y, Wilson R, Heiss J, et al. DNA methylation signatures in peripheral blood strongly predict all-cause mortality. Nat Commun. 2017, 8: 14617. DOI: 10.1038/ ncomms14617.
18、López-Otín C, Blasco MA, Partridge L, et al., The hallmarks of aging. Cell. 2013. 153(6): 1194-1217. DOI: 10.1016/j.cell.2013.05.039.López-Otín C, Blasco MA, Partridge L, et al., The hallmarks of aging. Cell. 2013. 153(6): 1194-1217. DOI: 10.1016/j.cell.2013.05.039.
19、Bocklandt S, Lin W, Sehl ME, et al. Epigenetic predictor of age. PLoS One. 2011, 6(6): e14821. DOI: 10.1371/ journal.pone.0014821.Bocklandt S, Lin W, Sehl ME, et al. Epigenetic predictor of age. PLoS One. 2011, 6(6): e14821. DOI: 10.1371/ journal.pone.0014821.
20、Verschoor CP, Lin DTS, Kobor MS, et al. Epigenetic age is associated with baseline and 3-year change in frailty in the Canadian Longitudinal Study on Aging. Clin Epigenet. 2021, 13(1): 163. DOI: 10.1186/s13148-021-01150-1.Verschoor CP, Lin DTS, Kobor MS, et al. Epigenetic age is associated with baseline and 3-year change in frailty in the Canadian Longitudinal Study on Aging. Clin Epigenet. 2021, 13(1): 163. DOI: 10.1186/s13148-021-01150-1.
21、Maddock J, Castillo-Fernandez J, Wong A, et al. DNA methylation age and physical and cognitive ageing. J Gerontol Ser A. 2020:75(3):504-511.. DOI: 10.1093/ gerona/glz246.Maddock J, Castillo-Fernandez J, Wong A, et al. DNA methylation age and physical and cognitive ageing. J Gerontol Ser A. 2020:75(3):504-511.. DOI: 10.1093/ gerona/glz246.
22、McCrory C, Fiorito G, Hernandez B, et al. GrimAge outperforms other epigenetic clocks in the prediction of age-related clinical phenotypes and all-cause mortality. J Gerontol Ser A. 2021, 76(5): 741-749. DOI: 10.1093/ gerona/glaa286.McCrory C, Fiorito G, Hernandez B, et al. GrimAge outperforms other epigenetic clocks in the prediction of age-related clinical phenotypes and all-cause mortality. J Gerontol Ser A. 2021, 76(5): 741-749. DOI: 10.1093/ gerona/glaa286.
23、Hillary RF, Stevenson AJ, Cox SR, et al. An epigenetic predictor of death captures multi-modal measures of brain health. Mol Psychiatry. 2021, 26: 3806-3816. DOI: 10.1038/s41380-019-0616-9.Hillary RF, Stevenson AJ, Cox SR, et al. An epigenetic predictor of death captures multi-modal measures of brain health. Mol Psychiatry. 2021, 26: 3806-3816. DOI: 10.1038/s41380-019-0616-9.
24、Peters MJ, Joehanes R, Pilling LC, et al. The transcriptional landscape of age in human peripheral blood. Nat Commun. 2015, 6: 8570. DOI: 10.1038/ncomms9570.Peters MJ, Joehanes R, Pilling LC, et al. The transcriptional landscape of age in human peripheral blood. Nat Commun. 2015, 6: 8570. DOI: 10.1038/ncomms9570.
25、Fleischer JG, Schulte R, Tsai HH, et al. Predicting age from the transcriptome of human dermal fibroblasts. Genome Biol. 2018, 19(1): 221. DOI: 10.1186/s13059- 018-1599-6.Fleischer JG, Schulte R, Tsai HH, et al. Predicting age from the transcriptome of human dermal fibroblasts. Genome Biol. 2018, 19(1): 221. DOI: 10.1186/s13059- 018-1599-6.
26、Holzscheck%20N%2C%20Falckenhayn%20C%2C%20S%C3%B6hle%20J%2C%20et%20al.%20Modeling%0Atranscriptomic%20age%20using%20knowledge-primed%20artificial%20%0Aneural%20networks.%20NPJ%20Aging%20Mech%20Dis.%202021%2C7(1)%3A15.%20DOI%3A%0A10.1038%2Fs41514-021-00068-5.Holzscheck%20N%2C%20Falckenhayn%20C%2C%20S%C3%B6hle%20J%2C%20et%20al.%20Modeling%0Atranscriptomic%20age%20using%20knowledge-primed%20artificial%20%0Aneural%20networks.%20NPJ%20Aging%20Mech%20Dis.%202021%2C7(1)%3A15.%20DOI%3A%0A10.1038%2Fs41514-021-00068-5.
27、Ignjatovic V, Lai C, Summerhayes R, et al. Age-related differences in plasma proteins: how plasma proteins change from neonates to adults. PLoS One. 2011, 6(2): e17213. DOI: 10.1371/journal.pone.0017213.Ignjatovic V, Lai C, Summerhayes R, et al. Age-related differences in plasma proteins: how plasma proteins change from neonates to adults. PLoS One. 2011, 6(2): e17213. DOI: 10.1371/journal.pone.0017213.
28、Baird GS, Nelson SK, Keeney TR, et al. Age-dependent changes in the cerebrospinal fluid proteome by slow offrate modified aptamer array. Am J Pathol. 2012, 180(2): 446-456. DOI: 10.1016/j.ajpath.2011.10.024.Baird GS, Nelson SK, Keeney TR, et al. Age-dependent changes in the cerebrospinal fluid proteome by slow offrate modified aptamer array. Am J Pathol. 2012, 180(2): 446-456. DOI: 10.1016/j.ajpath.2011.10.024.
29、Menni, C., et al., Circulating proteomic signatures of chronological age. J Gerontol A Biol Sci Med Sci. 2015, 70(7): 809-816. DOI: 10.1093/gerona/glu121.Menni, C., et al., Circulating proteomic signatures of chronological age. J Gerontol A Biol Sci Med Sci. 2015, 70(7): 809-816. DOI: 10.1093/gerona/glu121.
30、Tanaka T, Biancotto A, Moaddel R, et al. Plasma proteomic signature of age in healthy humans. Aging Cell. 2018, 17(5): e12799. DOI: 10.1111/acel.12799.Tanaka T, Biancotto A, Moaddel R, et al. Plasma proteomic signature of age in healthy humans. Aging Cell. 2018, 17(5): e12799. DOI: 10.1111/acel.12799.
31、Lehallier B, Gate D, Schaum N, et al. Undulating changes in human plasma proteome profiles across the lifespan. Nat Med. 2019, 25(12): 1843-1850. DOI: 10.1038/s41591- 019-0673-2.Lehallier B, Gate D, Schaum N, et al. Undulating changes in human plasma proteome profiles across the lifespan. Nat Med. 2019, 25(12): 1843-1850. DOI: 10.1038/s41591- 019-0673-2.
32、Wolf J, Rasmussen DK, Sun YJ, et al. Liquid-biopsy proteomics combined with AI identifies cellular drivers of eye aging and disease in vivo. Cell. 2023, 186(22): 4868- 4884.e12. DOI: 10.1016/j.cell.2023.09.012.Wolf J, Rasmussen DK, Sun YJ, et al. Liquid-biopsy proteomics combined with AI identifies cellular drivers of eye aging and disease in vivo. Cell. 2023, 186(22): 4868- 4884.e12. DOI: 10.1016/j.cell.2023.09.012.
33、Deelen J, Kettunen J, Fischer K, et al. A metabolic profile of all-cause mortality risk identified in an observational study of 44, 168 individuals. Nat Commun. 2019, 10: 3346. DOI: 10.1038/s41467-019-11311-9.Deelen J, Kettunen J, Fischer K, et al. A metabolic profile of all-cause mortality risk identified in an observational study of 44, 168 individuals. Nat Commun. 2019, 10: 3346. DOI: 10.1038/s41467-019-11311-9.
34、van den Akker EB, Trompet S, Barkey Wolf JJH, et al. Metabolic age based on the BBMRI-NL 1H-NMR metabolomics repository as biomarker of age-related disease. Circ Genom Precis Med. 2020, 13(5): 541-547. DOI: 10.1161/CIRCGEN.119.002610.van den Akker EB, Trompet S, Barkey Wolf JJH, et al. Metabolic age based on the BBMRI-NL 1H-NMR metabolomics repository as biomarker of age-related disease. Circ Genom Precis Med. 2020, 13(5): 541-547. DOI: 10.1161/CIRCGEN.119.002610.
35、Robinson O, Chadeau Hyam M, Karaman I, et al. Determinants of accelerated metabolomic and epigenetic aging in a UK cohort. Aging Cell. 2020, 19(6): e13149. DOI: 10.1111/acel.13149.Robinson O, Chadeau Hyam M, Karaman I, et al. Determinants of accelerated metabolomic and epigenetic aging in a UK cohort. Aging Cell. 2020, 19(6): e13149. DOI: 10.1111/acel.13149.
36、Hertel J, Friedrich N, Wittfeld K, et al. Measuring biological age via metabonomics: the metabolic age score. J Proteome Res. 2016, 15(2): 400-410. DOI: 10.1021/acs. jproteome.5b00561.Hertel J, Friedrich N, Wittfeld K, et al. Measuring biological age via metabonomics: the metabolic age score. J Proteome Res. 2016, 15(2): 400-410. DOI: 10.1021/acs. jproteome.5b00561.
37、Le%20Couteur%20DG%2C%20Simpson%20SJ%2C%20de%20Cabo%20R.%20Are%20glycans%20the%20%0Aholy%20grail%20for%20biomarkers%20of%20aging%3F%20(comment%20on%3A%20glycans%0Aare%20a%20novel%20biomarker%20of%20chronological%20and%20biological%20age%0Aby%20kristic%20et%20Al.).%20J%20Gerontol%20Ser%20A%20Biol%20Sci%20Med%20Sci.%202014%2C%0A69(7)%3A%20777-778.%20DOI%3A%2010.1093%2Fgerona%2Fglt202.Le%20Couteur%20DG%2C%20Simpson%20SJ%2C%20de%20Cabo%20R.%20Are%20glycans%20the%20%0Aholy%20grail%20for%20biomarkers%20of%20aging%3F%20(comment%20on%3A%20glycans%0Aare%20a%20novel%20biomarker%20of%20chronological%20and%20biological%20age%0Aby%20kristic%20et%20Al.).%20J%20Gerontol%20Ser%20A%20Biol%20Sci%20Med%20Sci.%202014%2C%0A69(7)%3A%20777-778.%20DOI%3A%2010.1093%2Fgerona%2Fglt202.
38、Galkin F, Mamoshina P, Aliper A, et al. Human gut microbiome aging clock based on taxonomic profiling and deep learning. iScience. 2020, 23(6): 101199. DOI: 10.1016/j.isci.2020.101199.Galkin F, Mamoshina P, Aliper A, et al. Human gut microbiome aging clock based on taxonomic profiling and deep learning. iScience. 2020, 23(6): 101199. DOI: 10.1016/j.isci.2020.101199.
39、Putin E, Mamoshina P, Aliper A, et al. Deep biomarkers of human aging: application of deep neural networks to biomarker development. Aging. 2016, 8(5): 1021-1033. DOI: 10.18632/aging.100968.Putin E, Mamoshina P, Aliper A, et al. Deep biomarkers of human aging: application of deep neural networks to biomarker development. Aging. 2016, 8(5): 1021-1033. DOI: 10.18632/aging.100968.
40、Mamoshina P, Kochetov K, Putin E, et al. Population specific biomarkers of human aging: a big data study using South Korean, Canadian, and eastern European patient populations. J Gerontol Ser A Biol Sci Med Sci. 2018, 73(11): 1482-1490. DOI: 10.1093/gerona/gly005.Mamoshina P, Kochetov K, Putin E, et al. Population specific biomarkers of human aging: a big data study using South Korean, Canadian, and eastern European patient populations. J Gerontol Ser A Biol Sci Med Sci. 2018, 73(11): 1482-1490. DOI: 10.1093/gerona/gly005.
41、Mamoshina P, Kochetov K, Cortese F, et al. Blood biochemistry analysis to detect smoking status and quantify accelerated aging in smokers. Sci Rep. 2019, 9(1): 142. DOI: 10.1038/s41598-018-35704-w.Mamoshina P, Kochetov K, Cortese F, et al. Blood biochemistry analysis to detect smoking status and quantify accelerated aging in smokers. Sci Rep. 2019, 9(1): 142. DOI: 10.1038/s41598-018-35704-w.
42、Liu Z, Kuo PL, Horvath S, et al. A new aging measure captures morbidity and mortality risk across diverse subpopulations from NHANES IV: a cohort study. PLoS Med. 2018, 15(12): e1002718. DOI: 10.1371/journal. pmed.1002718.Liu Z, Kuo PL, Horvath S, et al. A new aging measure captures morbidity and mortality risk across diverse subpopulations from NHANES IV: a cohort study. PLoS Med. 2018, 15(12): e1002718. DOI: 10.1371/journal. pmed.1002718.
43、Abbott A. Dementia: a problem for our age. Nature, 2011, 475(7355): S2-S4. DOI: 10.1038/475S2a.Abbott A. Dementia: a problem for our age. Nature, 2011, 475(7355): S2-S4. DOI: 10.1038/475S2a.
44、Cole JH, Ritchie SJ, Bastin ME, et al. Brain age predicts mortality. Mol Psychiatry. 2018, 23(5): 1385-1392. DOI: 10.1038/mp.2017.62.Cole JH, Ritchie SJ, Bastin ME, et al. Brain age predicts mortality. Mol Psychiatry. 2018, 23(5): 1385-1392. DOI: 10.1038/mp.2017.62.
45、Elliott ML, Belsky DW, Knodt AR, et al. Brain-age in midlife is associated with accelerated biological aging and cognitive decline in a longitudinal birth cohort. Mol Psychiatry. 2021, 26(8): 3829-3838. DOI: 10.1038/ s41380-019-0626-7.Elliott ML, Belsky DW, Knodt AR, et al. Brain-age in midlife is associated with accelerated biological aging and cognitive decline in a longitudinal birth cohort. Mol Psychiatry. 2021, 26(8): 3829-3838. DOI: 10.1038/ s41380-019-0626-7.
46、Bulpitt CJ, Rajkumar C, Cameron JD. Cameron, Vascular compliance as a measure of biological age. J Am Geriatr Soc. 1999,47(6):657-63. DOI: 10.1111/j.1532-5415.1999. tb01586.x.Bulpitt CJ, Rajkumar C, Cameron JD. Cameron, Vascular compliance as a measure of biological age. J Am Geriatr Soc. 1999,47(6):657-63. DOI: 10.1111/j.1532-5415.1999. tb01586.x.
47、McClelland RL, Nasir K, Budoff M, et al. Arterial age as a function of coronary artery calcium (from the Multi-Ethnic Study of Atherosclerosis[MESA]). Am J Cardiol. 2009, 103(1): 59-63. DOI: 10.1016/j.amjcard.2008.08.031.McClelland RL, Nasir K, Budoff M, et al. Arterial age as a function of coronary artery calcium (from the Multi-Ethnic Study of Atherosclerosis[MESA]). Am J Cardiol. 2009, 103(1): 59-63. DOI: 10.1016/j.amjcard.2008.08.031.
48、Nilsson%20Wadstr%C3%B6m%20B%2C%20Fatehali%20AA%20H%2C%20Engstr%C3%B6m%20G%2C%20et%0Aal.%20A%20vascular%20aging%20index%20as%20independent%20predictor%20of%0Acardiovascular%20events%20and%20total%20mortality%20in%20an%20elderly%0Aurban%20population.%20Angiology.%202019%2C%2070(10)%3A%20929-937.%20DOI%3A%0A10.1177%2F0003319719857270.Nilsson%20Wadstr%C3%B6m%20B%2C%20Fatehali%20AA%20H%2C%20Engstr%C3%B6m%20G%2C%20et%0Aal.%20A%20vascular%20aging%20index%20as%20independent%20predictor%20of%0Acardiovascular%20events%20and%20total%20mortality%20in%20an%20elderly%0Aurban%20population.%20Angiology.%202019%2C%2070(10)%3A%20929-937.%20DOI%3A%0A10.1177%2F0003319719857270.
49、G a l e C R , C o o p e r C , S a y e r A A . F r a m i n g h a m cardiovascular disease risk scores and incident frailty: the English longitudinal study of ageing. AGE. 2014, 36(4): 9692. DOI: 10.1007/s11357-014-9692-6.G a l e C R , C o o p e r C , S a y e r A A . F r a m i n g h a m cardiovascular disease risk scores and incident frailty: the English longitudinal study of ageing. AGE. 2014, 36(4): 9692. DOI: 10.1007/s11357-014-9692-6.
50、Raghu VK, Weiss J, Hoffmann U, et al. Deep learning to estimate biological age from chest radiographs. JACC Cardiovasc Imag. 2021, 14(11): 2226-2236. DOI: 10.1016/ j.jcmg.2021.01.008.Raghu VK, Weiss J, Hoffmann U, et al. Deep learning to estimate biological age from chest radiographs. JACC Cardiovasc Imag. 2021, 14(11): 2226-2236. DOI: 10.1016/ j.jcmg.2021.01.008.
51、Christensen K, Thinggaard M, McGue M, et al. Perceived age as clinically useful biomarker of ageing: cohort study. BMJ. 2009, 339: b5262. DOI: 10.1136/bmj.b5262.Christensen K, Thinggaard M, McGue M, et al. Perceived age as clinically useful biomarker of ageing: cohort study. BMJ. 2009, 339: b5262. DOI: 10.1136/bmj.b5262.
52、Xia X, Chen X, Wu G, et al. Three-dimensional facialimage analysis to predict heterogeneity of the human ageing rate and the impact of lifestyle. Nat Metab. 2020, 2(9): 946-957. DOI: 10.1038/s42255-020-00270-x.Xia X, Chen X, Wu G, et al. Three-dimensional facialimage analysis to predict heterogeneity of the human ageing rate and the impact of lifestyle. Nat Metab. 2020, 2(9): 946-957. DOI: 10.1038/s42255-020-00270-x.
53、Yu Z, Zhou Y, Mao K, et al. Thermal facial image analyses reveal quantitative hallmarks of aging and metabolic diseases. Cell Metab. 2024, 36(7): 1482-1493.e7. DOI: 10.1016/j.cmet.2024.05.012.Yu Z, Zhou Y, Mao K, et al. Thermal facial image analyses reveal quantitative hallmarks of aging and metabolic diseases. Cell Metab. 2024, 36(7): 1482-1493.e7. DOI: 10.1016/j.cmet.2024.05.012.
54、Zhu Z, Shi D, Guankai P, et al. Retinal age gap as a predictive biomarker for mortality risk. Br J Ophthalmol. 2023, 107(4): 547-554. DOI: 10.1136/bjophthalmol- 2021- 319807.Zhu Z, Shi D, Guankai P, et al. Retinal age gap as a predictive biomarker for mortality risk. Br J Ophthalmol. 2023, 107(4): 547-554. DOI: 10.1136/bjophthalmol- 2021- 319807.
55、Hu W, Wang W, Wang Y, et al. Retinal age gap as a predictive biomarker of future risk of Parkinson’s disease. Age Ageing. 2022, 51(3): afac062. DOI: 10.1093/ageing/ afac062.Hu W, Wang W, Wang Y, et al. Retinal age gap as a predictive biomarker of future risk of Parkinson’s disease. Age Ageing. 2022, 51(3): afac062. DOI: 10.1093/ageing/ afac062.
56、Nusinovici S, Rim TH, Yu M, et al. Retinal photographbased deep learning predicts biological age, and stratifies morbidity and mortality risk. Age Ageing. 2022, 51(4): afac065. DOI: 10.1093/ageing/afac065.Nusinovici S, Rim TH, Yu M, et al. Retinal photographbased deep learning predicts biological age, and stratifies morbidity and mortality risk. Age Ageing. 2022, 51(4): afac065. DOI: 10.1093/ageing/afac065.
57、Liu C, Wang W, Li Z, et al. Biological age estimated from retinal imaging: a novel biomarker of aging[M]//Lecture Notes in Computer Science. Cham: Springer International Publishing. 2019: 138-146. DOI: 10.1007/978-3-030- 32239-7_16.Liu C, Wang W, Li Z, et al. Biological age estimated from retinal imaging: a novel biomarker of aging[M]//Lecture Notes in Computer Science. Cham: Springer International Publishing. 2019: 138-146. DOI: 10.1007/978-3-030- 32239-7_16.
58、Li R, Chen W, Li M, et al. LensAge index as a deep learning-based biological age for self-monitoring the risks of age-related diseases and mortality. Nat Commun. 2023, 14(1): 7126. DOI: 10.1038/s41467-023-42934-8.Li R, Chen W, Li M, et al. LensAge index as a deep learning-based biological age for self-monitoring the risks of age-related diseases and mortality. Nat Commun. 2023, 14(1): 7126. DOI: 10.1038/s41467-023-42934-8.
59、Li Q, Wang S, Milot E, et al. Homeostatic dysregulation proceeds in parallel in multiple physiological systems. Aging Cell. 2015, 14(6): 1103-1112. DOI: 10.1111/acel. 12402.Li Q, Wang S, Milot E, et al. Homeostatic dysregulation proceeds in parallel in multiple physiological systems. Aging Cell. 2015, 14(6): 1103-1112. DOI: 10.1111/acel. 12402.
60、Belsky%20DW%2C%20Moffitt%20TE%2C%20Cohen%20AA%2C%20et%20al.%20Eleven%20telomere%2C%0Aepigenetic%20clock%2C%20and%20biomarker-composite%20quantifications%0Aof%20biological%20aging%3A%20do%20they%20measure%20the%20same%20thing%3F%20Am%20J%0AEpidemiol.%202018%20Jun%201%3B%20187(6)%3A1220-1230.%20DOI%3A%2010.1093%2F%0Aaje%2Fkwx346.Belsky%20DW%2C%20Moffitt%20TE%2C%20Cohen%20AA%2C%20et%20al.%20Eleven%20telomere%2C%0Aepigenetic%20clock%2C%20and%20biomarker-composite%20quantifications%0Aof%20biological%20aging%3A%20do%20they%20measure%20the%20same%20thing%3F%20Am%20J%0AEpidemiol.%202018%20Jun%201%3B%20187(6)%3A1220-1230.%20DOI%3A%2010.1093%2F%0Aaje%2Fkwx346.
1、This work was supported by the National Natural Science Foundation of China (82171035, 82301266), the High-level Science and Technology Journals Projects of Guangdong Province (2021B1212010003), Guangdong Basic and Applied Basic Research Foundation (2024A1515012001), China Postdoctoral Science Foundation (2023M744033), the Postdoctoral Fellowship Program of CPSF (GZB20230896), and Basic scientific research projects of Sun Yat-sen University (23ykcxqt002). The funders had no role in the study design, data collection and analysis, decision to publish, or preparation of the manuscript.()
上一篇
下一篇
出版者信息
目录